Vistra Excel edition
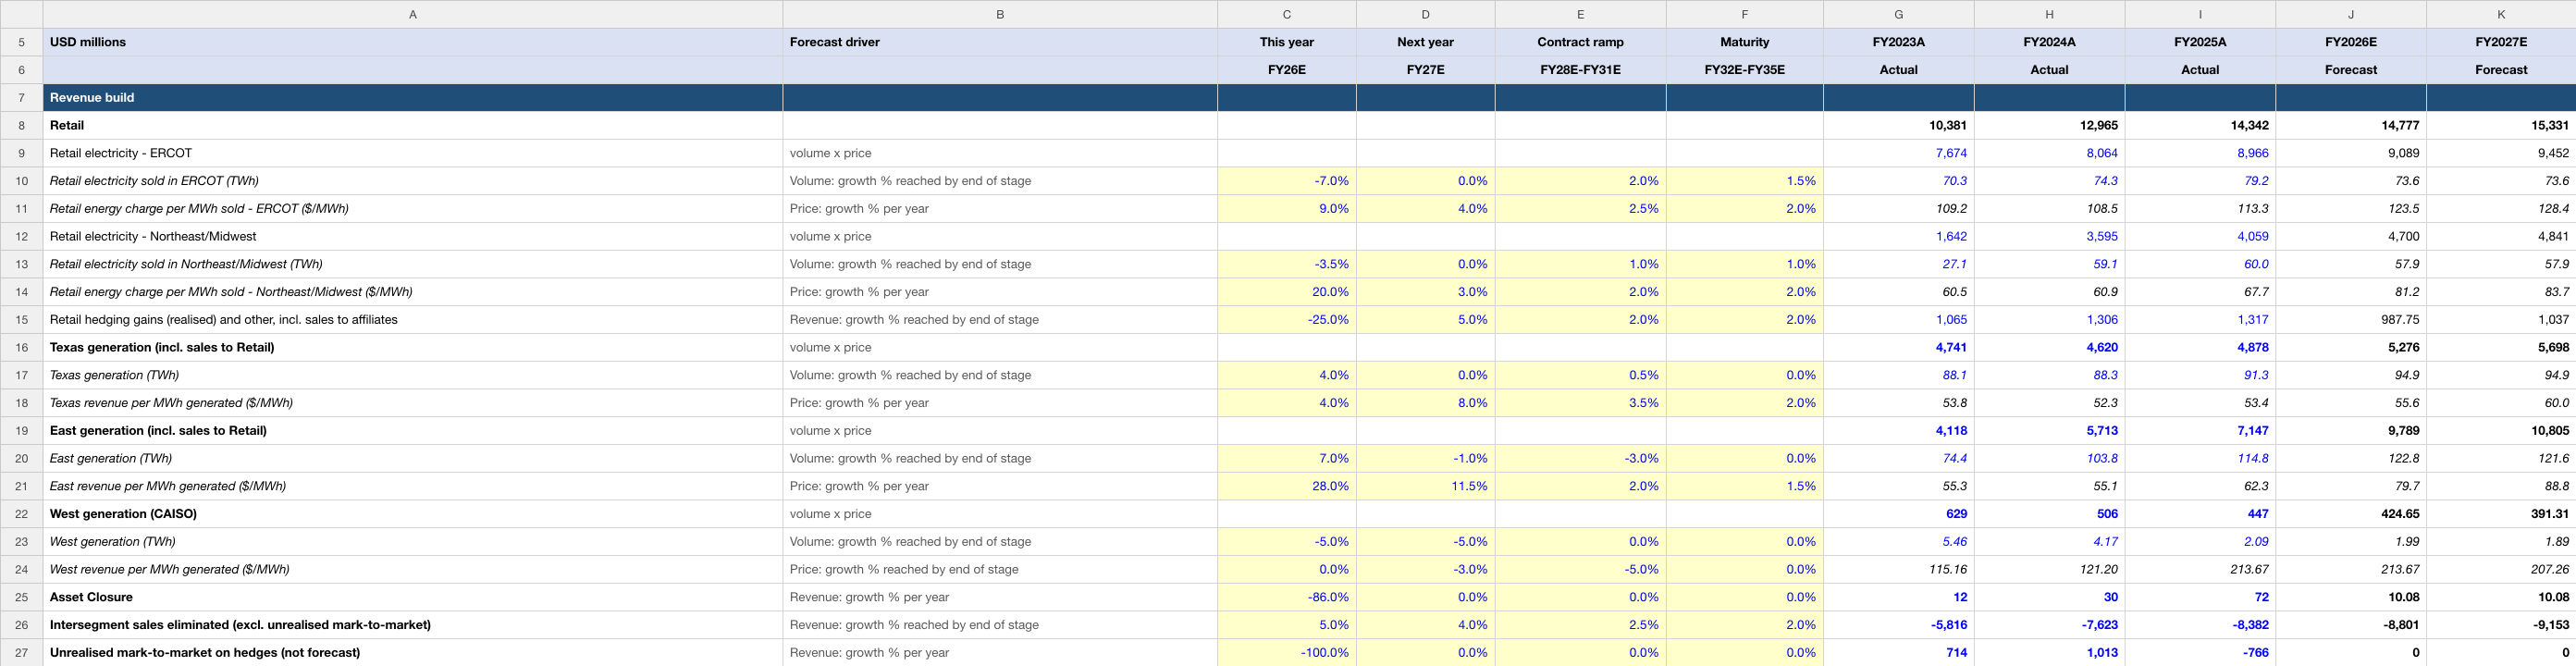
Retail electricity sold, generation TWh by region and revenue per MWh. Change the highlighted assumptions to explore the relationship between operating performance, cash flow and value.
Inside the workbook
- Income Statement, Balance Sheet, Cash Flow and DCF Valuation worksheets.
- Three historical fiscal years and ten modeled periods with source and forecast notes.
- Discounted cash flows, terminal-value methods and valuation sensitivities.
| Edition detail | Included |
|---|---|
| Valuation date | 5 October 2026 |
| Historical periods | FY2023A, FY2024A, FY2025A |
| Modeled periods | FY2026E–FY2035E |
| Financial currency | USD in millions |
| Format | Editable .xlsx · Four worksheets · 55.9 KB |
| Price | US$19.99 for 12 months of company-model access |
Historical figures recorded in this edition
These are cached historical entries in the uploaded Vistra workbook, dated 5 October 2026. Fiscal-year labels and units follow the file; they are not live data. The source annotations below are the model author’s references, rather than an independent audit of every figure.
| Metric | FY2023A | FY2024A | FY2025A |
|---|---|---|---|
| Total revenue | 14,779.00 | 17,224.00 | 17,738.00 |
| Operating income (EBIT) | 2,661.00 | 4,081.00 | 1,906.00 |
| Net income | 1,493.00 | 2,659.00 | 944.00 |
How this edition builds the forecast
Retail electricity sold, generation TWh by region and revenue per MWh. The first forecast period is FY2026E. The editable assumptions distinguish the operating driver from the reasoning used to forecast it.
Retail electricity sold in ERCOT (TWh)
Mechanism: Volume: growth % reached by end of stage
Inputs shown in this file: FY26E: -7.0% · FY27E: 0.0% · FY28E-FY31E: 2.0% · FY32E-FY35E: 1.5%
Read this driver’s forecast rationale
ERCOT retail volumes were 34.2 TWh in 1H26 against 37.9 TWh in 1H25 (-9.6%); the company cites lower customer consumption on weather (SEC Form 10-Q for the quarter ended 2026-06-30, filed 2026-08-10, MD&A Retail). Assumption: -7% for the year as the second-half comparison eases, flat in FY27, then ~2% growth as ERCOT load grows (large data centres, oilfield electrification; SEC Form 10-Q for the quarter ended 2026-06-30, filed 2026-08-10, Electricity Demand).
Read the workbook’s historical source annotation
SEC Form 10-K for the year ended 2025-12-31, filed 2026-02-27, MD&A Retail: sales volumes in ERCOT 79,165 GWh (FY25) and 74,295 (FY24); SEC Form 10-K for the year ended 2024-12-31, filed 2025-02-28, MD&A: 70,275 GWh (FY23)
Retail energy charge per MWh sold - ERCOT ($/MWh)
Mechanism: Price: growth % per year
Inputs shown in this file: FY26E: 9.0% · FY27E: 4.0% · FY28E-FY31E: 2.5% · FY32E-FY35E: 2.0%
Read this driver’s forecast rationale
Implied $109 / $108 / $113 per MWh in FY23-FY25. 1H26 was $121 per MWh (+9%) on higher contractual rates (SEC Form 10-Q for the quarter ended 2026-06-30, filed 2026-08-10, Retail discussion). Assumption: +9% for FY26 (the 1H26 run-rate), +4% in FY27 (contracts reprice at the higher 2026 rates), then 2.5% and 2% a year, which includes transmission and distribution charges passed through to customers.
Retail electricity sold in Northeast/Midwest (TWh)
Mechanism: Volume: growth % reached by end of stage
Inputs shown in this file: FY26E: -3.5% · FY27E: 0.0% · FY28E-FY31E: 1.0% · FY32E-FY35E: 1.0%
Read this driver’s forecast rationale
Energy Harbor closed on 2024-03-01 (SEC Form 10-K for the year ended 2025-12-31, filed 2026-02-27, MD&A), which is why FY24 is more than double FY23; history includes Energy Harbor from that date. 1H26 volumes were 27.7 TWh against 28.7 TWh (-3.7%) (SEC Form 10-Q for the quarter ended 2026-06-30, filed 2026-08-10). Assumption: -3.5% in FY26, flat in FY27, then ~1% growth.
Read the workbook’s historical source annotation
SEC Form 10-K for the year ended 2025-12-31, filed 2026-02-27, MD&A Retail: Northeast/Midwest 59,974 GWh (FY25) and 59,066 (FY24); SEC Form 10-K for the year ended 2024-12-31, filed 2025-02-28, MD&A: 27,147 GWh (FY23, before Energy Harbor)
The later forecast years contain modeling judgments. The historical labels, financial-period dates and valuation date are separate from any stock-price observation; this page does not supply a current market quote.
One company. One year of access.
Your US$19.99 one-time purchase includes 12 months of downloads and updates for this company’s model. No automatic renewal. Downloaded files remain usable after access ends; no fixed update cadence is promised.
Read the current version’s notes
USD in millions, fiscal year ending December 31. Base case: FY2026E and FY2027E revenue are set near analyst consensus and FY2026E operating profit near the company's published guidance; later years are this model's own assumptions, each explained in the last column. Unrealised mark-to-market on hedges is shown in history but not forecast. The pending Cogentrix acquisition is not included.
Dates and descriptions reflect this workbook’s notes. They are not a claim of independent audit or a guarantee that its forecasts will occur.