Vertiv Excel edition
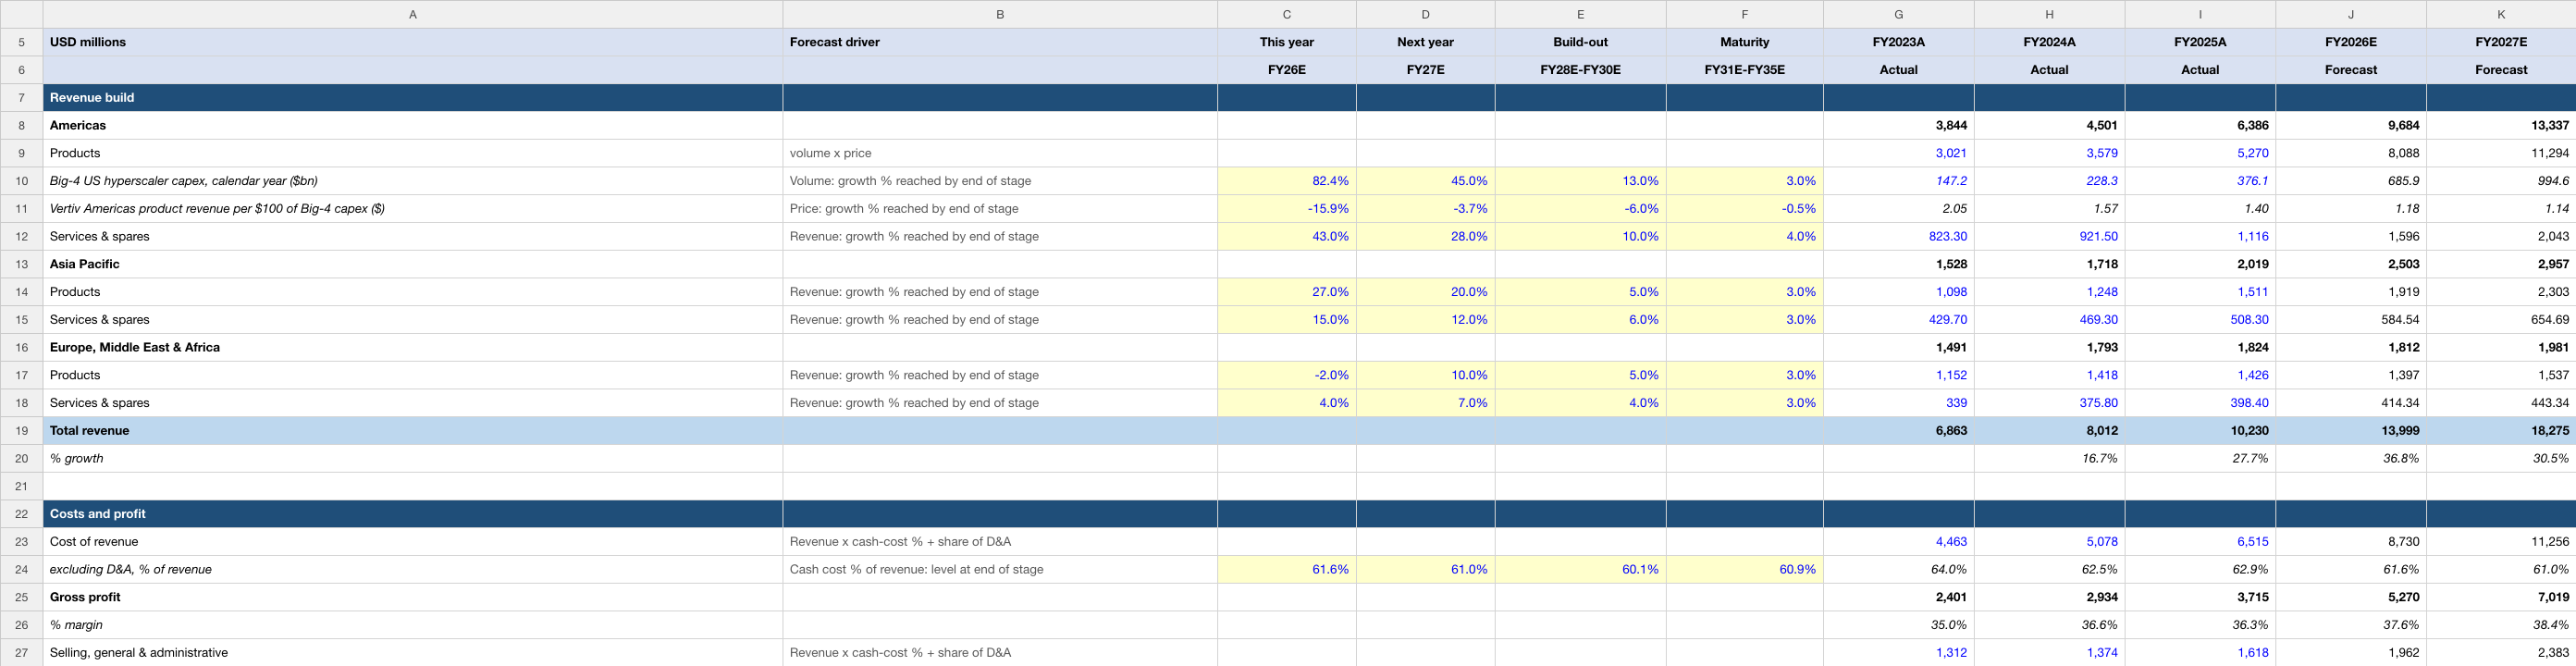
Americas product revenue per $100 of hyperscaler capex, regional products and services. Change the highlighted assumptions to explore the relationship between operating performance, cash flow and value.
Inside the workbook
- Income Statement, Balance Sheet, Cash Flow and DCF Valuation worksheets.
- Three historical fiscal years and ten modeled periods with source and forecast notes.
- Discounted cash flows, terminal-value methods and valuation sensitivities.
| Edition detail | Included |
|---|---|
| Valuation date | 5 October 2026 |
| Historical periods | FY2023A, FY2024A, FY2025A |
| Modeled periods | FY2026E–FY2035E |
| Financial currency | USD in millions |
| Format | Editable .xlsx · Four worksheets · 55.3 KB |
| Price | US$19.99 for 12 months of company-model access |
Historical figures recorded in this edition
These are cached historical entries in the uploaded Vertiv workbook, dated 5 October 2026. Fiscal-year labels and units follow the file; they are not live data. The source annotations below are the model author’s references, rather than an independent audit of every figure.
| Metric | FY2023A | FY2024A | FY2025A |
|---|---|---|---|
| Total revenue | 6,863.20 | 8,011.80 | 10,229.90 |
| Operating income (EBIT) | 872.20 | 1,367.40 | 1,829.70 |
| Net income | 460.20 | 495.80 | 1,332.80 |
How this edition builds the forecast
Americas product revenue per $100 of hyperscaler capex, regional products and services. The first forecast period is FY2026E. The editable assumptions distinguish the operating driver from the reasoning used to forecast it.
Big-4 US hyperscaler capex, calendar year ($bn)
Mechanism: Volume: growth % reached by end of stage
Inputs shown in this file: FY26E: 82.4% · FY27E: 45.0% · FY28E-FY30E: 13.0% · FY31E-FY35E: 3.0%
Read this driver’s forecast rationale
Big-4 capex was $294.8bn in 1H 2026, up 84% on $160.1bn in 1H 2025 (Amazon $98.4bn, Alphabet $80.6bn, Meta $49.1bn, Microsoft $66.7bn, being its FY2026 total of $115.9bn less $49.3bn for July-December 2025; hyperscaler 10-Qs for the quarter ended 2026-06-30 (Amazon.com filed 2026-07-31, Alphabet 2026-07-23, Meta Platforms 2026-07-30) and Microsoft 10-K FY2026 (filed 2026-07-29)). Meta guides $130-145bn for 2026 (Meta Q2 2026 10-Q) and Alphabet expects to raise 2026 investment in technical infrastructure significantly above 2025 (Alphabet Q2 2026 10-Q). Dated headlines: Amazon raised 2026 capex to $220bn (mlq.ai, 2026-08-02); big-tech AI spending of about $760bn in 2026 (Statista, 2026-07-31); Big Tech capex seen above $1 trillion in 2027 (CNBC, 2026-04-30). Company view of the market: data-center physical-infrastructure capex is projected to grow ~18% a year over 2025-2030 and Vertiv's served market ~16-18% (Vertiv 2026 Investor Conference presentation, 19-May-2026 (company IR site), pp.18, 19, 42); Vertiv's own projection for 2030 is in the ratio's basis below. Assumption: +82.4% in 2026 (~$686bn, so 2H is ~$391bn against $295bn in 1H), +45% in 2027 (~$995bn), then growth fading year by year to 13.0% by 2030 (+34.3%, +23.7% and +13.0% in 2028-30; ~$1.87tn in 2030), still below the 16-18% a year the company cites for its market, and to 3.0% by 2035 (~$2.61tn), the terminal growth rate. The fade ends in 2030, a year earlier than a four-year build-out stage would end it, because the company's projection window ends in 2030, so that Vertiv's FY2030 revenue lands inside the company's 20-22% growth framework (see the ratio below).
Read the workbook’s historical source annotation
hyperscaler cash flow statements, purchases of (Microsoft: additions to) property and equipment: Amazon.com 10-K FY2025 filed 2026-02-06; Alphabet 10-K FY2025 filed 2026-02-05; Meta Platforms 10-K FY2025 filed 2026-01-29; Microsoft 10-K FY2025 filed 2025-07-30 and 10-Qs for Dec-2023 (filed 2024-01-30) and Dec-2025 (filed 2026-01-28). Terms: Amazon + Alphabet + Meta + Microsoft, in $mm and divided by 1,000; Microsoft (June year end) is put on a calendar year as fiscal year - prior July-December + current July-December.
Vertiv Americas product revenue per $100 of Big-4 capex ($)
Mechanism: Price: growth % reached by end of stage
Inputs shown in this file: FY26E: -15.9% · FY27E: -3.7% · FY28E-FY30E: -6.0% · FY31E-FY35E: -0.5%
Read this driver’s forecast rationale
Implied $2.05 / $1.57 / $1.40 of Americas product revenue per $100 of Big-4 capex in 2023-2025: the ratio has fallen as hyperscale capex goes increasingly to compute chips and memory rather than facility power and cooling (interpretation; not disclosed). Americas product sales were $3,142.0mm in 1H26, +37.9% (organic +34.4%) (SEC Form 10-Q for quarter ended 2026-06-30, filed 2026-07-29, Note 4; Q2 2026 earnings release (Form 8-K exhibit 99.1, filed 2026-07-29)). Demand evidence: Q4 2025 organic orders +252% year on year, book-to-bill ~2.9x and backlog $15.0bn at December 2025 (+109%), the majority expected to ship within 12-18 months (Q4 2025 earnings release (Form 8-K exhibit 99.1, filed 2026-02-11); SEC Form 10-K for fiscal year ended 2025-12-31, filed 2026-02-13, Item 1 Backlog); current deferred revenue (customer advances) doubled to $3,633.7mm at 30-Jun-2026 from $1,814.7mm (SEC Form 10-Q for quarter ended 2026-06-30, filed 2026-07-29). The Q1 and Q2 2026 releases give no backlog or order figure (Q1 2026 earnings release (Form 8-K exhibit 99.1, filed 2026-04-22); Q2 2026 earnings release (Form 8-K exhibit 99.1, filed 2026-07-29)). FY2026 level is set so total revenue lands on the guidance midpoint of $14,000mm (organic +31%; Q2 2026 earnings release (Form 8-K exhibit 99.1, filed 2026-07-29)); Q2 revenue slipped on temporary supply-chain congestion and multi-phased project timing (Q2 2026 earnings release (Form 8-K exhibit 99.1, filed 2026-07-29)). FY2027 level is set so total revenue lands on consensus ($18.3bn). Assumption: the ratio falls 15.9% in 2026 and 3.7% in 2027, then keeps eroding, by 6.0% by 2030 (-4.5%, -5.2% and -6.0% in 2028-30, in line with its fall of 11% in 2025 and 23% in 2024 rather than the 3.7% of 2027) and then at an easing rate to -0.5% by 2035, so Americas product revenue grows ~53% in 2026 and ~40% in 2027 against capex growth of 82% and 45%, then ~28%, ~17% and ~6% in 2028-30 against capex growth of 34%, 24% and 13%, and below capex growth throughout. Company framework (the check on the mid term): at its May-2026 investor conference in Greenville, SC, Vertiv set a 5-year framework to 2030 of 20-22% organic revenue growth a year, an adjusted operating margin of 27% by 2030, capex of 3-4% of revenue a year and adjusted free cash flow conversion of 95-100%, with data-center power capacity additions rising from about 20 GW a year toward about 35 GW (TIKR.com, article on Vertiv's May-2026 investor conference in Greenville, SC, 2026-05-31). The company's own conference presentation shows the same growth, margin and capex figures and net sales of about $26bn in 2030 (Vertiv 2026 Investor Conference presentation, 19-May-2026 (company IR site), pp.16, 44 for the ~$26B of 2030 sales and pp.39, 50 for the 20-22% growth rate; pp.16, 39, 42, 50 for margin; p.47 for capex), with 2026 at $13.75bn, the guidance midpoint of that date; the Q2 2026 release raised the 2026 guidance midpoint to $14.0bn and does not mention the 2030 projection (Q2 2026 earnings release (Form 8-K exhibit 99.1, filed 2026-07-29)). 20-22% a year from $10.23bn is $25.5-27.6bn; the acquisitions closed by 30-Jun-2026 are not in that organic figure and add roughly $1.0-1.3bn of 2030 sales (estimate: they contributed 5% of Q2 2026 net sales, about $0.5bn a year, Q2 2026 earnings release (Form 8-K exhibit 99.1, filed 2026-07-29), grown at 20-25% a year), so the framework's range for total 2030 revenue is about $26.5-28.9bn. Like for like: the 2026 guidance of $14.0bn with organic growth of 31% is $13.4bn of organic sales ($10.23bn x 1.31), so about $0.6bn of 2026 sales comes from acquisitions and currency (Q2 2026 earnings release (Form 8-K exhibit 99.1, filed 2026-07-29)), and the company's 20-22% is an organic rate. The model's FY2030 total revenue is $27.5bn, a 21.9% CAGR from FY2025: the top of the 20-22% range if the range is applied to total revenue ($27.6bn), and about the midpoint of it on an organic basis, because taking out roughly $1.0-1.3bn of acquired and currency sales leaves an organic-equivalent FY2030 of $26.2-26.5bn, a 20.7-21.0% CAGR (the 21% midpoint is $26.5bn). The company's own ~$26B marker is a rounded figure at the low end of its range (a 20.5% CAGR from $10.2bn); holding total revenue at $26.0bn would put the organic-equivalent FY2030 at $24.7-25.0bn, a 19.3-19.6% CAGR, below the 20% floor. The top of the range applies to total revenue, so the other five lines are moderated too (see their basis). Why growth falls after 2027: consensus for 2027 ($18.3bn, +30.6%) is already well above the ~$16bn that the company's own path implies for 2027 (2026 at $13.75bn growing at the ~17% a year that reaches $26bn), so meeting both consensus and the framework means growth of 14.6% a year over 2028-30 on average: the model has +23.1%, +14.9% and +6.4%, falling every year, then 5.7%, 5.0%, 4.3%, 3.6% and 2.8% in 2031-35. Growth of 6.4% in 2030 is still well below the 16-18% a year of the market the company cites (Vertiv 2026 Investor Conference presentation, 19-May-2026 (company IR site), pp.18, 19, 42). A four-year build-out stage (2028-2031) cannot do this: with the same end values FY2030 revenue would be $30.8bn, and holding FY2030 at $27.5bn needs revenue to fall 2.0% in 2031. The build-out stage is therefore three years (2028-2030, the company's projection window ends in 2030) and maturity five years (2031-2035); growth after 2030 is the model's own and fades to terminal growth.
Services & spares
Mechanism: Revenue: growth % reached by end of stage
Inputs shown in this file: FY26E: 43.0% · FY27E: 28.0% · FY28E-FY30E: 10.0% · FY31E-FY35E: 4.0%
Read this driver’s forecast rationale
Americas services & spares were $743.2mm in 1H26, +46.2% (organic +15.8%; acquisitions added $150.4mm, including PurgeRite, a fluid-management services business bought on 4-Dec-2025) (Q2 2026 earnings release (Form 8-K exhibit 99.1, filed 2026-07-29)); growth was +11.9% in 2024 and +21.1% in 2025. Assumption: +43% in 2026 (acquisition effect carries to year end, organic ~15-20%), +28% in 2027 as the hyperscale equipment installed in 2025-26 enters maintenance and fluid-management contracts, then fading to 10% by 2030 and 4% by 2035. The company describes services growth of 20%+ as accelerating on install-base expansion (Vertiv 2026 Investor Conference presentation, 19-May-2026 (company IR site), p.44); the 10% for 2030 is a moderation so that total revenue stays within the company's 20-22% growth framework, and it is the highest 2030 rate of the five lines grown at a rate because the installed base keeps growing after equipment shipments slow. Limitation: Vertiv does not disclose the installed base under service contract, contract counts or renewal rates, so no volume x price build is possible; services & spares (maintenance, commissioning, fluid management, spare parts, software) can only be grown at a rate.
Read the workbook’s historical source annotation
SEC Form 10-K for fiscal year ended 2025-12-31, filed 2026-02-13, Note 3 - Revenue, Disaggregation of Revenues (segment x offering): Americas, Services & spares
The later forecast years contain modeling judgments. The historical labels, financial-period dates and valuation date are separate from any stock-price observation; this page does not supply a current market quote.
One company. One year of access.
Your US$19.99 one-time purchase includes 12 months of downloads and updates for this company’s model. No automatic renewal. Downloaded files remain usable after access ends; no fixed update cadence is promised.
Read the current version’s notes
USD in millions, fiscal year ending December 31. Base case: FY2026E follows the company's published full-year guidance (within 1% of analyst consensus) and FY2027E revenue is set to land on analyst consensus; FY2030E revenue (about $27.5bn) is set at the top of the company's 20-22% a year growth framework applied to total revenue, about the midpoint of it once acquired and currency sales are taken out (Vertiv 2026 Investor Conference presentation, 19-May-2026 (company IR site)); the FY2030E adjusted operating margin is a stated one-point moderation of the company's ~27%+ target (Vertiv 2026 Investor Conference presentation, 19-May-2026 (company IR site)); later years are this model's own assumptions, each explained in the last column. Acquisitions announced but not closed are left out.
Dates and descriptions reflect this workbook’s notes. They are not a claim of independent audit or a guarantee that its forecasts will occur.