Micron Excel edition
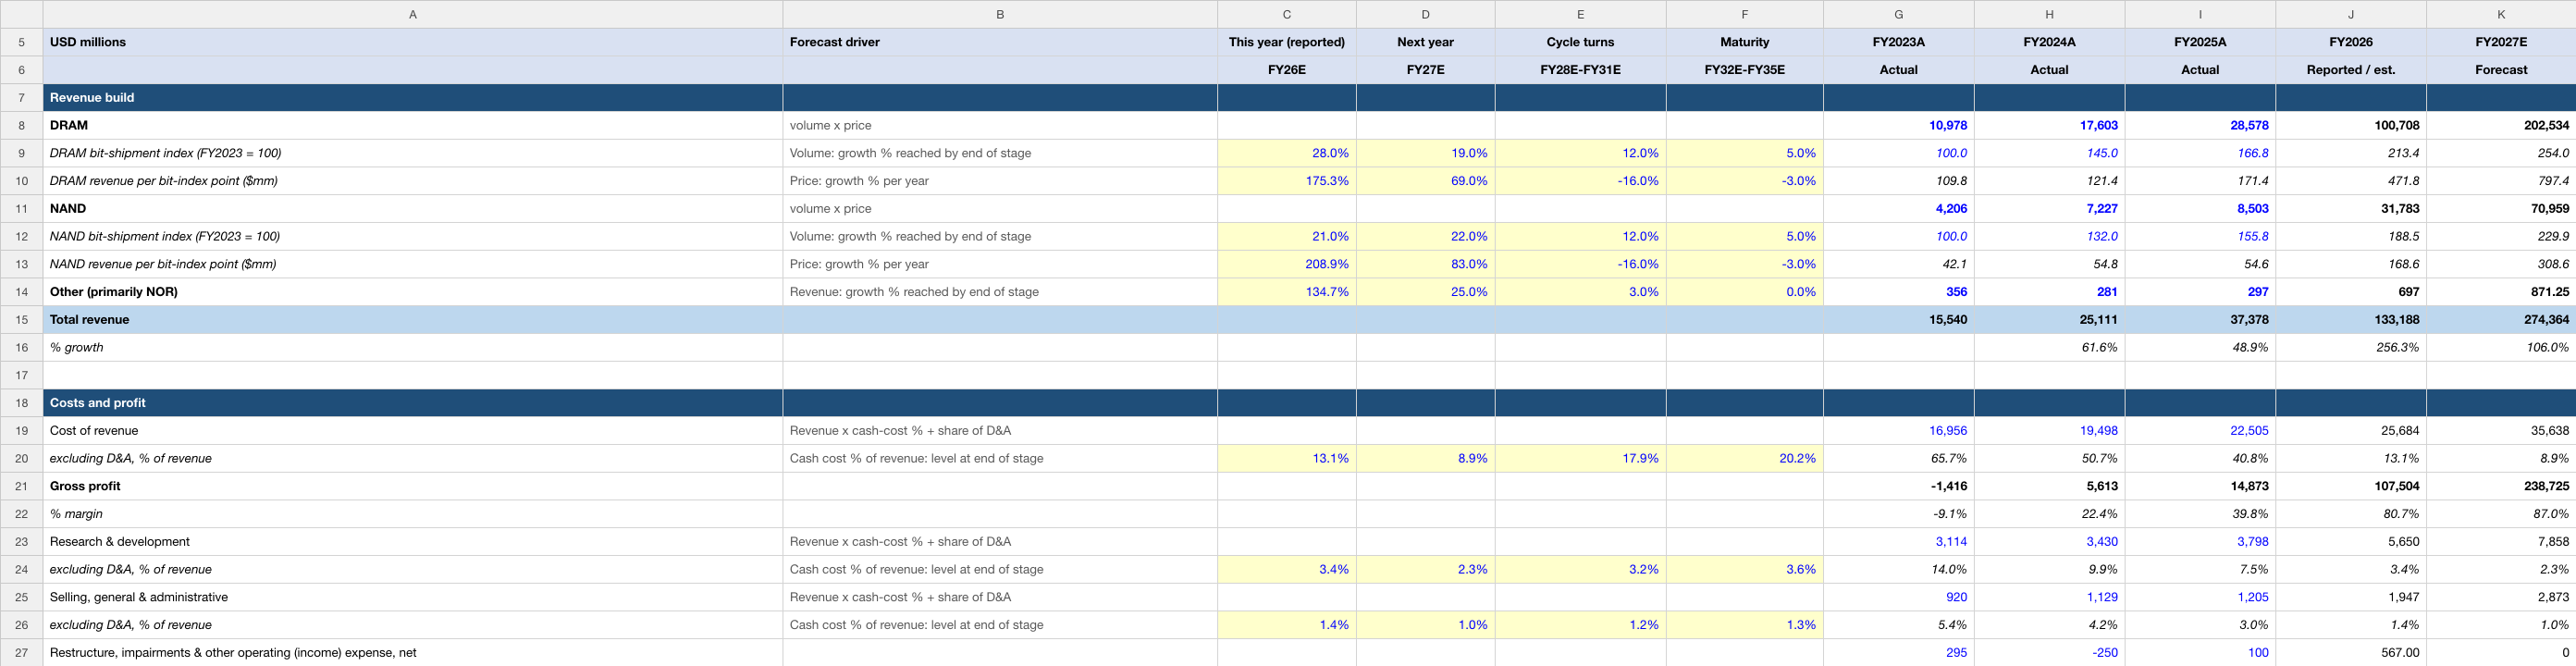
DRAM and NAND bit-shipment indices and revenue per bit-index point. Change the highlighted assumptions to explore the relationship between operating performance, cash flow and value.
Inside the workbook
- Income Statement, Balance Sheet, Cash Flow and DCF Valuation worksheets.
- Three historical fiscal years and ten modeled periods with source and forecast notes.
- Discounted cash flows, terminal-value methods and valuation sensitivities.
| Edition detail | Included |
|---|---|
| Valuation date | 5 October 2026 |
| Historical periods | FY2023A, FY2024A, FY2025A |
| Modeled periods | FY2026–FY2035E |
| Financial currency | USD in millions |
| Format | Editable .xlsx · Four worksheets · 49.3 KB |
| Price | US$19.99 for 12 months of company-model access |
Historical figures recorded in this edition
These are cached historical entries in the uploaded Micron workbook, dated 5 October 2026. Fiscal-year labels and units follow the file; they are not live data. The source annotations below are the model author’s references, rather than an independent audit of every figure.
| Metric | FY2023A | FY2024A | FY2025A |
|---|---|---|---|
| Total revenue | 15,540.00 | 25,111.00 | 37,378.00 |
| Operating income (EBIT) | -5,745.00 | 1,304.00 | 9,770.00 |
| Net income | -5,833.00 | 778.00 | 8,539.00 |
How this edition builds the forecast
DRAM and NAND bit-shipment indices and revenue per bit-index point. The first forecast period is FY2026. The editable assumptions distinguish the operating driver from the reasoning used to forecast it.
DRAM bit-shipment index (FY2023 = 100)
Mechanism: Volume: growth % reached by end of stage
Inputs shown in this file: FY26E: 28.0% · FY27E: 19.0% · FY28E-FY31E: 12.0% · FY32E-FY35E: 5.0%
Read this driver’s forecast rationale
DRAM bit shipments rose about 30% in the first nine months of FY2026 against the first nine months of FY2025 (SEC Form 10-Q for the quarter ended 2026-05-28, filed 2026-06-25, MD&A - Total Revenue); Q3 was up a low-20% range on a year earlier and Q4 rose a mid-single-digit percentage on Q3 (SEC Form 10-Q for the quarter ended 2026-05-28, filed 2026-06-25; Q4 fiscal 2026 earnings call of 2026-09-30, as reported by MarketBeat (2026-09-30), TrendForce (2026-10-01) and Blocks & Files (2026-10-01)), in a 14-week quarter (SEC Form 10-Q for the quarter ended 2026-05-28, filed 2026-06-25, Note 1: FY2026 has 53 weeks, FY2025 52). Assumption for FY2026: about +28% for the year, the nine-month rate trimmed for a slightly lower Q4; the matching price change is the residual that reproduces reported DRAM revenue of about $100.7bn (nine months $60,908mm from SEC Form 10-Q for the quarter ended 2026-05-28, filed 2026-06-25, Note 14, plus Q4 $39.8bn from Q4 fiscal 2026 earnings call of 2026-09-30, as reported by MarketBeat (2026-09-30), TrendForce (2026-10-01) and Blocks & Files (2026-10-01)). FY2027: Micron expects industry DRAM bit shipments to grow in the low-20% range in calendar 2027 and 2028 with supply constrained (Q4 fiscal 2026 earnings call of 2026-09-30, as reported by MarketBeat (2026-09-30), TrendForce (2026-10-01) and Blocks & Files (2026-10-01)) and aims to hold bit share (SEC Form 10-K for fiscal 2025 (52 weeks ended 2025-08-28), filed 2025-10-03, MD&A - Liquidity); FY2027 has 52 weeks against 53, so about +19%. Assumption after: growth eases to 12% by FY2031 and 5% by FY2035 as new cleanroom space arrives (Idaho ID1 mid-2027, ID2 and Japan late 2028, New York 2030; Q4 fiscal 2026 earnings call of 2026-09-30, as reported by MarketBeat (2026-09-30), TrendForce (2026-10-01) and Blocks & Files (2026-10-01)) and the base grows.
Read the workbook’s historical source annotation
Index built from the MD&A sentences on bit shipments, with each stated range turned into a point value: FY2024 'a mid-40% range increase in bit shipments' (typed as +45%; SEC Form 10-K for fiscal 2025 (52 weeks ended 2025-08-28), filed 2025-10-03 and SEC Form 10-K for fiscal 2024 (52 weeks ended 2024-08-29), filed 2024-10-04, MD&A - Total Revenue) and FY2025 'a mid-teen percentage increase in bit shipments' (+15%; SEC Form 10-K for fiscal 2025 (52 weeks ended 2025-08-28), filed 2025-10-03, MD&A - Total Revenue). FY2023 = 100 by construction. The company does not publish bit volumes, so the index has a precision of a few points.
DRAM revenue per bit-index point ($mm)
Mechanism: Price: growth % per year
Inputs shown in this file: FY26E: 175.3% · FY27E: 69.0% · FY28E-FY31E: -16.0% · FY32E-FY35E: -3.0%
Read this driver’s forecast rationale
Revenue per index point was $109.8mm, $121.4mm and $171.4mm in FY2023-FY2025 (+11% and +41%; the 10-K gives 'low-teen' and 'low-40% range' ASP increases, SEC Form 10-K for fiscal 2025 (52 weeks ended 2025-08-28), filed 2025-10-03, MD&A). DRAM ASPs rose about 140% in the first nine months of FY2026 and in the low-260% range in Q3 against a year earlier (SEC Form 10-Q for the quarter ended 2026-05-28, filed 2026-06-25, MD&A); Q4 ASPs rose in the high-teens percentage on Q3 (Q4 fiscal 2026 earnings call of 2026-09-30, as reported by MarketBeat (2026-09-30), TrendForce (2026-10-01) and Blocks & Files (2026-10-01)). FY2026 value = the residual that reproduces reported revenue (about +175%). FY2027 (+69%, set with NAND so total revenue lands on consensus of $274.7bn, +106%): mostly the carry-over of FY2026's rises into the FY2027 average; Micron guides FQ1-27 revenue to $61.5bn +/- $1.5bn and expects prices to keep rising at a more moderate pace (Q4 and fiscal 2026 earnings release (Form 8-K Exhibit 99.1, 2026-09-30; unaudited); Q4 fiscal 2026 earnings call of 2026-09-30, as reported by MarketBeat (2026-09-30), TrendForce (2026-10-01) and Blocks & Files (2026-10-01)). Assumption after, and the most value-sensitive assumption in the model: price falls 16% a year over FY2028-FY2031, then 3% a year over FY2032-FY2035 (the price change fading toward zero at maturity). This goes against what management said on the Q4 call: it expects memory and storage supply-demand conditions to be 'much tighter in fiscal 2027 and 2028 than they were in 2026' and says it has no 'line of sight to when supply and demand will return to balance' (Q4 fiscal 2026 earnings call of 2026-09-30, as reported by MarketBeat (2026-09-30), TrendForce (2026-10-01) and Blocks & Files (2026-10-01)). Most new capacity comes late: Idaho ID1 starts wafer output in mid-calendar 2027, but ID2, the Japan DRAM expansion and the Singapore NAND facility start in late calendar 2028, which is FY2029 (Q4 fiscal 2026 earnings call of 2026-09-30, as reported by MarketBeat (2026-09-30), TrendForce (2026-10-01) and Blocks & Files (2026-10-01)). A price fall that starts in FY2028 therefore goes against both management's statement and FY2028 consensus: consensus has FY2028 revenue up 14.3% ($314.1bn on $274.7bn), this model has it down 1.0%. It also sits awkwardly with the FY2028 DRAM bit growth used here, about +17% and described as supply constrained: a 16% price fall on 17% more bits leaves DRAM revenue about 1.5% lower. The stage layout [1,1,4,4] gives one price rate to all four years FY2028-FY2031, so the model cannot hold prices up in FY2028 and start the fall in FY2029; the turn cannot be placed in FY2029 without changing the layout. Anchor: after the FY2018 peak DRAM ASPs fell about 30% in FY2019 and in the mid-30% range in FY2020, about 54% in two years (SEC Form 10-K for fiscal 2019 (52 weeks ended 2019-08-29), filed 2019-10-17 and SEC Form 10-K for fiscal 2020 (53 weeks ended 2020-09-03), filed 2020-10-19, MD&A - Total Revenue), and price changes were positive again in later years (annual DRAM changes over the five years to FY2025 ranged from plus low-40% to minus high-40%, SEC Form 10-K for fiscal 2025 (52 weeks ended 2025-08-28), filed 2025-10-03, Item 1A). This model's path is larger than that anchor and has no recovery: 0.84^4 x 0.97^4 leaves price at about 44% of its FY2027 level in FY2035, a cumulative fall of about 56%, against about 54% in the FY2019-FY2020 anchor. It is a steeper, longer fall, not a match. Value sensitivity (scratch rebuilds of this workbook, DRAM and NAND price changed together): with the stage-3 price change at -12% instead of -16%, value per share is about $1,134 with every cost ratio unchanged and about $1,182 with cost of goods sold re-derived so that cost per bit stays flat, against $996 at -16% ($1,063 to $1,086 at -14%); the share price is $1,063.96, so this one assumption decides whether the model shows downside or upside, and each point on the stage-3 rate is worth about $33 to $48 a share. Cross-check: Micron's 26 strategic customer agreements are take-or-pay with about $150bn of remaining performance obligations, at minimum volumes and minimum prices, and Micron says they cover more than 35% of revenue through 2030 (Q4 fiscal 2026 earnings call of 2026-09-30, as reported by MarketBeat (2026-09-30), TrendForce (2026-10-01) and Blocks & Files (2026-10-01)); that is far below this model's FY2027-FY2030 revenue of about $1.06tn, because the price floors are well under current prices, so most modelled revenue is not contractually secured. A smooth path cannot show the cycle: real prices will swing around it, and the first fall could come sooner or later than FY2028.
NAND bit-shipment index (FY2023 = 100)
Mechanism: Volume: growth % reached by end of stage
Inputs shown in this file: FY26E: 21.0% · FY27E: 22.0% · FY28E-FY31E: 12.0% · FY32E-FY35E: 5.0%
Read this driver’s forecast rationale
NAND bit shipments rose in the low-20% range in the first nine months of FY2026 against the same period of FY2025 (SEC Form 10-Q for the quarter ended 2026-05-28, filed 2026-06-25, MD&A) and about 10% in Q4 on Q3 (Q4 fiscal 2026 earnings call of 2026-09-30, as reported by MarketBeat (2026-09-30), TrendForce (2026-10-01) and Blocks & Files (2026-10-01)). Assumption for FY2026: +21% (Q3 was up a low-double-digit percentage on a year earlier, SEC Form 10-Q for the quarter ended 2026-05-28, filed 2026-06-25); the price change is the residual that reproduces reported NAND revenue of about $31.8bn (nine months $17,683mm, SEC Form 10-Q for the quarter ended 2026-05-28, filed 2026-06-25 Note 14, plus Q4 $14.1bn, Q4 fiscal 2026 earnings call of 2026-09-30, as reported by MarketBeat (2026-09-30), TrendForce (2026-10-01) and Blocks & Files (2026-10-01)). FY2027: Micron expects industry NAND bit shipments to grow in the mid-20% range in calendar 2027 and 2028, supply constrained (Q4 fiscal 2026 earnings call of 2026-09-30, as reported by MarketBeat (2026-09-30), TrendForce (2026-10-01) and Blocks & Files (2026-10-01)); less the extra week in FY2026, about +22%. Assumption after: growth eases to 12% by FY2031 and 5% by FY2035. A new NAND facility in Singapore starts output in the second half of calendar 2028 (Q4 fiscal 2026 earnings call of 2026-09-30, as reported by MarketBeat (2026-09-30), TrendForce (2026-10-01) and Blocks & Files (2026-10-01)).
Read the workbook’s historical source annotation
Index built from the MD&A sentences on bit shipments, each range turned into a point value: FY2024 'a low-30% range increase in bit shipments' (+32%; SEC Form 10-K for fiscal 2025 (52 weeks ended 2025-08-28), filed 2025-10-03, MD&A - Total Revenue) and FY2025 'a high-teen percentage increase in bit shipments' (+18%; SEC Form 10-K for fiscal 2025 (52 weeks ended 2025-08-28), filed 2025-10-03, MD&A - Total Revenue). FY2023 = 100 by construction. Precision of a few points.
The later forecast years contain modeling judgments. The historical labels, financial-period dates and valuation date are separate from any stock-price observation; this page does not supply a current market quote.
One company. One year of access.
Your US$19.99 one-time purchase includes 12 months of downloads and updates for this company’s model. No automatic renewal. Downloaded files remain usable after access ends; no fixed update cadence is promised.
Read the current version’s notes
USD in millions, fiscal year ending the Thursday nearest August 31 (52/53-week year; FY2026 ended 3 September 2026 and had 53 weeks). Base case: history is FY2023-FY2025 (filed 10-Ks). FY2026 is reported but not yet filed: it reproduces the unaudited results in the 30-Sep-2026 earnings release. FY2027E revenue is set to land on analyst consensus; later years are this model's own assumptions, each explained in the last column. Memory pricing is cyclical: this smooth forecast does not model the cycle.
Dates and descriptions reflect this workbook’s notes. They are not a claim of independent audit or a guarantee that its forecasts will occur.