Marvell Excel edition
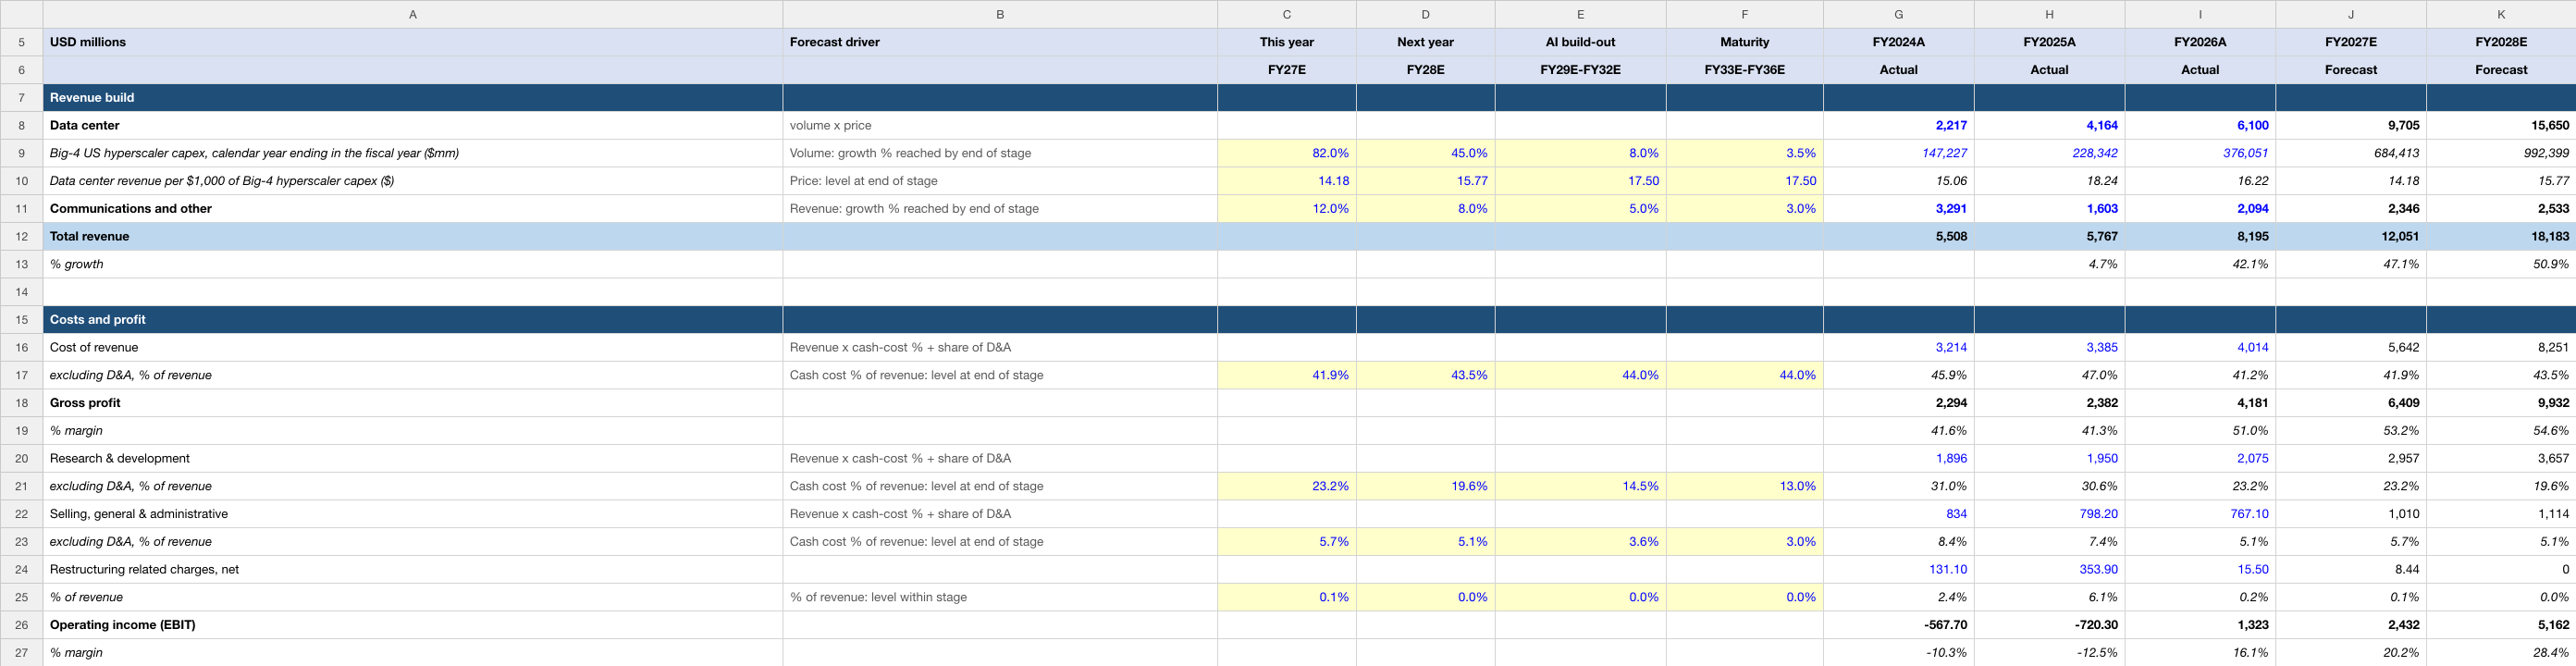
Data center revenue per $1,000 of hyperscaler capex, plus communications. Change the highlighted assumptions to explore the relationship between operating performance, cash flow and value.
Inside the workbook
- Income Statement, Balance Sheet, Cash Flow and DCF Valuation worksheets.
- Three historical fiscal years and ten modeled periods with source and forecast notes.
- Discounted cash flows, terminal-value methods and valuation sensitivities.
| Edition detail | Included |
|---|---|
| Valuation date | 5 October 2026 |
| Historical periods | FY2024A, FY2025A, FY2026A |
| Modeled periods | FY2027E–FY2036E |
| Financial currency | USD in millions |
| Format | Editable .xlsx · Four worksheets · 48.0 KB |
| Price | US$19.99 for 12 months of company-model access |
Historical figures recorded in this edition
These are cached historical entries in the uploaded Marvell workbook, dated 5 October 2026. Fiscal-year labels and units follow the file; they are not live data. The source annotations below are the model author’s references, rather than an independent audit of every figure.
| Metric | FY2024A | FY2025A | FY2026A |
|---|---|---|---|
| Total revenue | 5,507.70 | 5,767.30 | 8,194.60 |
| Operating income (EBIT) | -567.70 | -720.30 | 1,322.90 |
| Net income | -933.40 | -885.00 | 2,670.10 |
How this edition builds the forecast
Data center revenue per $1,000 of hyperscaler capex, plus communications. The first forecast period is FY2027E. The editable assumptions distinguish the operating driver from the reasoning used to forecast it.
Big-4 US hyperscaler capex, calendar year ending in the fiscal year ($mm)
Mechanism: Volume: growth % reached by end of stage
Inputs shown in this file: FY27E: 82.0% · FY28E: 45.0% · FY29E-FY32E: 8.0% · FY33E-FY36E: 3.5%
Read this driver’s forecast rationale
Big-4 capex was $294.8bn in the first half of 2026, up 84% on $160.1bn in the first half of 2025 (Amazon $98.4bn, Alphabet $80.6bn, Meta $49.1bn, Microsoft $66.7bn = FY2026 $115.9bn less July-December 2025 $49.3bn; hyperscaler filings for 2026: Amazon.com 10-Q for the quarter ended 2026-06-30 (filed 2026-07-31), Alphabet 10-Q for 2026-06-30 (filed 2026-07-23), Meta Platforms 10-Q for 2026-06-30 (filed 2026-07-30) and its Q2 2026 earnings release (Form 8-K exhibit 99.1, filed 2026-07-29), Microsoft 10-K FY2026 (filed 2026-07-29)). Meta guides 2026 capex including finance leases to $130-145bn (its Q2 2026 earnings release). Press: Tom's Hardware, 2026-04-30, put the four companies' 2026 capex at about $725bn, up 77%; mlq.ai, 2026-08-02, reported Amazon raising its 2026 AI capex to $220bn (headlines read via Google News; articles not opened). Assumption: +82% in 2026 (about $684bn, below the press totals because those mix in finance leases), +45% in 2027 (about $992bn), then growth fades year by year to 8% by 2031 (about $2.2tn) and 3.5% by 2035. This is the assumption the whole data-center forecast rests on.
Read the workbook’s historical source annotation
hyperscaler cash flow statements, purchases of (Microsoft: additions to) property and equipment: Amazon.com 10-K FY2025 filed 2026-02-06; Alphabet 10-K FY2025 filed 2026-02-05; Meta Platforms 10-K FY2025 filed 2026-01-29; Microsoft 10-K FY2025 filed 2025-07-30 and 10-Qs for Dec-2023 (filed 2024-01-30) and Dec-2025 (filed 2026-01-28). Terms: Amazon + Alphabet + Meta + Microsoft; Microsoft (June year end) is put on a calendar year as fiscal year - prior July-December + current July-December. Marvell's fiscal year runs February to January, so calendar 2025 is matched with FY2026.
Data center revenue per $1,000 of Big-4 hyperscaler capex ($)
Mechanism: Price: level at end of stage
Inputs shown in this file: FY27E: 14.18 · FY28E: 15.77 · FY29E-FY32E: 17.5 · FY33E-FY36E: 17.5
Read this driver’s forecast rationale
Implied $15.06 / $18.24 / $16.22 of data center revenue per $1,000 of Big-4 capex (1.5% / 1.8% / 1.6%) in FY2024-FY2026. Data center revenue grew 46% year on year in Q2 FY2027 to $2,171.5mm, the CEO expects growth to accelerate through the rest of the year with a significant acceleration in the custom business from the second half, and has raised the FY2027 and FY2028 outlook (Q2 FY2027 earnings release (Form 8-K exhibit 99.1), filed 2026-08-27). The FY2027 level is set so total revenue lands on consensus ($12.05bn): first-half revenue of $5,157.1mm plus the Q3 outlook of $3,150mm +/-5% leaves about $3.7bn for Q4, a further 19% sequential rise. The FY2028 level is what consensus ($18.2bn, +51%) implies on 45% capex growth. Google signed a broad custom-silicon agreement with Marvell in July 2026, with a warrant that vests per $500mm of custom-product revenue over 240 tranches through FY2033 (Form 8-K filed 2026-08-19 (Item 1.01: commercial agreement with Google LLC and the warrant issued 2026-08-18)), which shows the scale both sides are planning for. Check on the mid term: this path gives cumulative data center revenue of about $188bn over FY2027-FY2033, while full vesting of the Google warrant would need $120bn of custom-product revenue from Google alone, so the model sits below the maximum in that agreement. Assumption: the ratio edges up to $17.50 per $1,000 (1.75%) by FY2032 as custom programs ramp, then holds; it is not extrapolated further.
Communications and other
Mechanism: Revenue: growth % reached by end of stage
Inputs shown in this file: FY27E: 12.0% · FY28E: 8.0% · FY29E-FY32E: 5.0% · FY33E-FY36E: 3.0%
Read this driver’s forecast rationale
Quarterly revenue after the automotive Ethernet business was sold on 2025-08-14: $556.6mm in Q3 FY2026 and $567.4mm in Q4 FY2026 (Q4 FY2026 earnings release (Form 8-K exhibit 99.1), filed 2026-03-05), $585.1mm in Q1 and $567.8mm in Q2 FY2027 (Q2 FY2027 earnings release (Form 8-K exhibit 99.1), filed 2026-08-27); the FY2026 base of $2,094.3mm still holds about two and a half quarters of the sold business, so the post-sale run-rate of about $2.3bn a year is the right base for FY2027, and the sold business is out of every forecast year. First-half FY2027 was $1,152.9mm, +19% on a base that still included the sold business; Marvell ascribes the recovery to normalising customer inventory (SEC Form 10-Q for quarter ended 2026-08-01 (Q2 FY2027), filed 2026-08-28, MD&A). Of this end market's $1,603.1mm in FY2025, enterprise networking was $626.4mm, carrier $338.2mm, consumer $316.1mm and automotive/industrial $322.4mm (SEC Form 10-K for fiscal year ended 2025-02-01 (FY2025), filed 2025-03-12, Note 3), down from $3,291.0mm in FY2024 after the FY2025 restructuring. Assumption: +12% in FY2027 (post-sale run-rate plus a small rise), +8% in FY2028, then growth fades to 5% by FY2032 and 3% at maturity. Limitation: Marvell stopped reporting enterprise networking, carrier infrastructure, consumer and automotive/industrial separately from Q4 FY2026, so the three-year history exists only for the combined end market, and it discloses no units, customers or prices for any of them. The public FY2025 split is quoted above; no FY2026 split exists, so the old five-way split cannot be kept.
Read the workbook’s historical source annotation
SEC Form 10-K for fiscal year ended 2026-01-31 (FY2026), filed 2026-03-11, Note 3 - Revenue, net revenue by end market: Communications and other (new end market from Q4 FY2026; it holds enterprise networking, carrier infrastructure, consumer and automotive/industrial)
The later forecast years contain modeling judgments. The historical labels, financial-period dates and valuation date are separate from any stock-price observation; this page does not supply a current market quote.
One company. One year of access.
Your US$19.99 one-time purchase includes 12 months of downloads and updates for this company’s model. No automatic renewal. Downloaded files remain usable after access ends; no fixed update cadence is promised.
Read the current version’s notes
USD in millions, fiscal year ending Saturday nearest January 31. Base case: FY2027E (this year) starts from the reported first-half results and the Q3 outlook, and FY2027E and FY2028E revenue land on analyst consensus; later years are this model's own assumptions, each explained in the last column.
Dates and descriptions reflect this workbook’s notes. They are not a claim of independent audit or a guarantee that its forecasts will occur.