Lumentum Excel edition
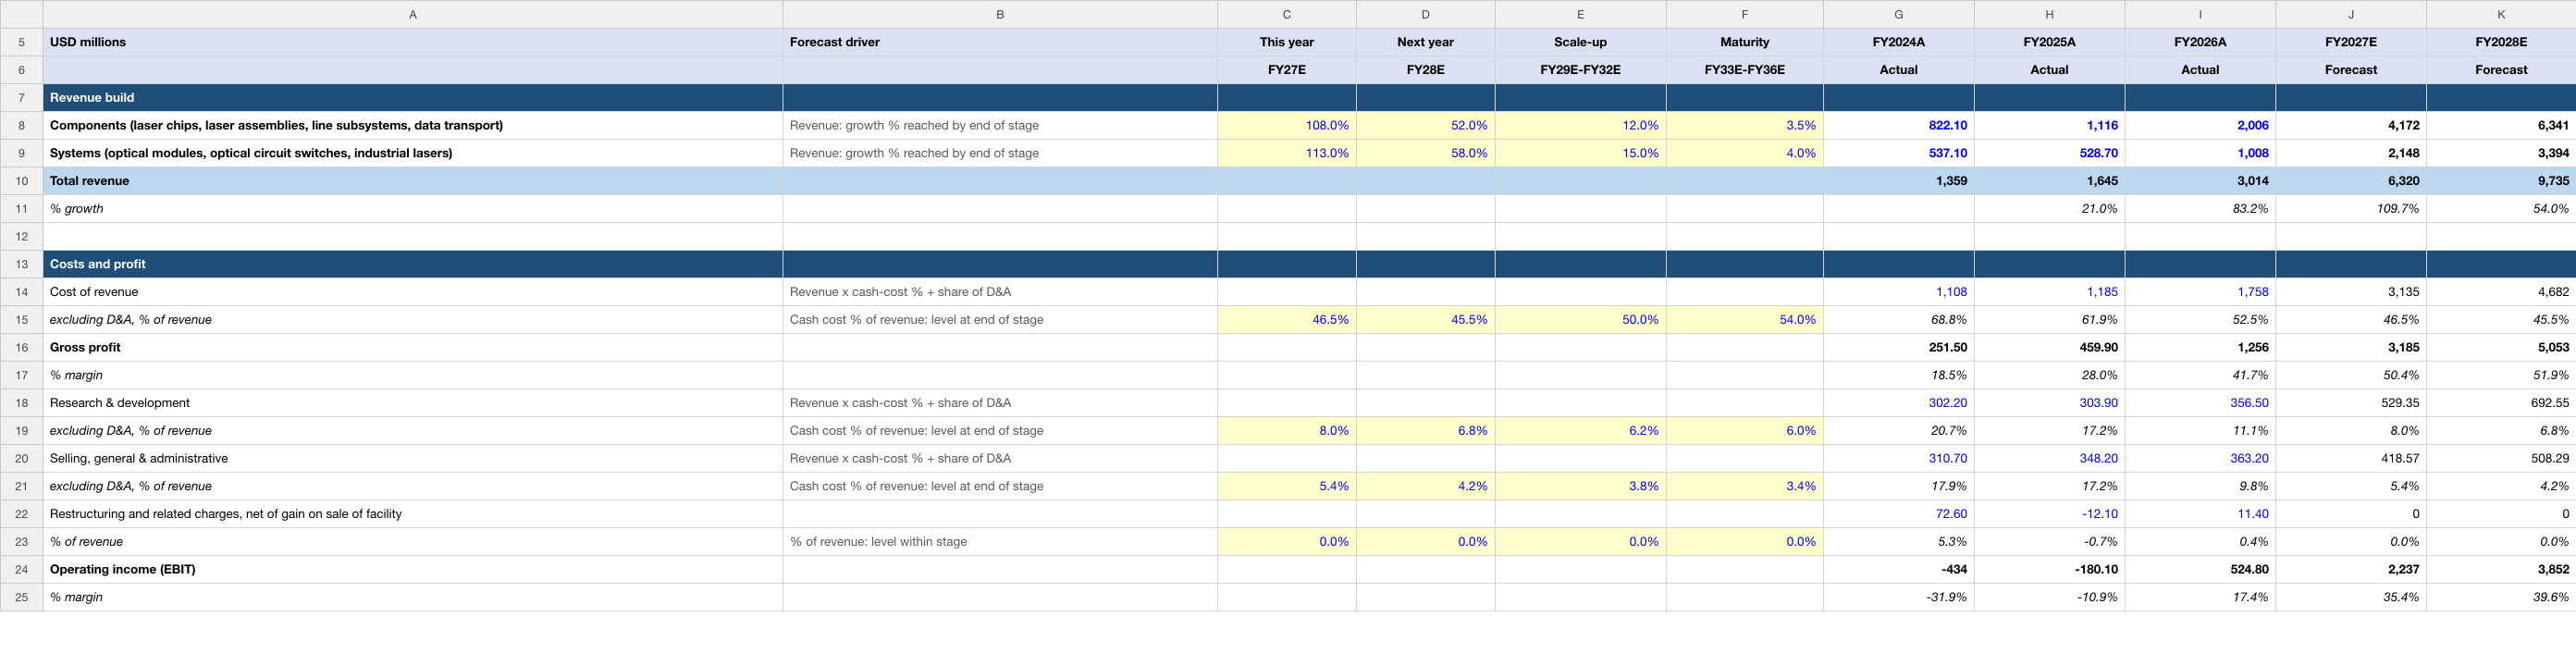
Components and Systems revenue, led by cloud optical modules. Change the highlighted assumptions to explore the relationship between operating performance, cash flow and value.
Inside the workbook
- Income Statement, Balance Sheet, Cash Flow and DCF Valuation worksheets.
- Three historical fiscal years and ten modeled periods with source and forecast notes.
- Discounted cash flows, terminal-value methods and valuation sensitivities.
| Edition detail | Included |
|---|---|
| Valuation date | 5 October 2026 |
| Historical periods | FY2024A, FY2025A, FY2026A |
| Modeled periods | FY2027E–FY2036E |
| Financial currency | USD in millions |
| Format | Editable .xlsx · Four worksheets · 46.1 KB |
| Price | US$19.99 for 12 months of company-model access |
Historical figures recorded in this edition
These are cached historical entries in the uploaded Lumentum workbook, dated 5 October 2026. Fiscal-year labels and units follow the file; they are not live data. The source annotations below are the model author’s references, rather than an independent audit of every figure.
| Metric | FY2024A | FY2025A | FY2026A |
|---|---|---|---|
| Total revenue | 1,359.20 | 1,645.00 | 3,014.00 |
| Operating income (EBIT) | -434.00 | -180.10 | 524.80 |
| Net income | -546.50 | 25.90 | -6,935.10 |
How this edition builds the forecast
Components and Systems revenue, led by cloud optical modules. The first forecast period is FY2027E. The editable assumptions distinguish the operating driver from the reasoning used to forecast it.
Components (laser chips, laser assemblies, line subsystems, data transport)
Mechanism: Revenue: growth % reached by end of stage
Inputs shown in this file: FY27E: 108.0% · FY28E: 52.0% · FY29E-FY32E: 12.0% · FY33E-FY36E: 3.5%
Read this driver’s forecast rationale
FY26 Components revenue was $2,005.6mm, up 79.7%; laser chip and laser assembly shipments were 78% of the $889.3mm increase (a slight price gain from the shift to 200G lanes) and data transport products (line subsystems, undersea charge pumps) the other ~22% (SEC Form 10-K for fiscal year ended 2026-06-27, filed 2026-08-17, MD&A, Net Revenue). Q4 FY26 Components revenue was $649.4mm, +21.8% on Q3 and +102.7% on Q4 FY25 (Q4 FY2026 earnings release (Form 8-K Exhibit 99.1) filed 2026-08-11). Total revenue guidance for Q1 FY27 is $1.225-1.275bn (Q4 FY2026 earnings release (Form 8-K Exhibit 99.1) filed 2026-08-11, Business Outlook), and the release cites demand for ultra-high-power CPO lasers and an initial ELS module order; a March 2026 agreement includes a multi-billion purchase commitment from one customer and capacity access rights for advanced laser components (SEC Form 8-K filed 2026-03-02 (Series A preferred stock sale; Exhibit 99.1 joint press release), Exhibit 99.1). Assumption: growth of about 108% in FY27 and 52% in FY28 puts total revenue within 5% of consensus ($6.3bn and $9.8bn; consensus FY27 revenue needs sequential growth of about 16% a quarter after the guided Q1, versus 24.5% in Q4 FY26 and quarterly revenue of $533.8mm, $665.5mm and $808.4mm in Q1-Q3 FY26 (SEC Forms 10-Q for the quarters ended 2025-09-27, 2025-12-27 and 2026-03-28 (filed 2025-11-05, 2026-02-04 and 2026-05-06)); FY27 also has a 53rd week (SEC Form 10-K for fiscal year ended 2026-06-27, filed 2026-08-17, Note 1)). Growth then fades to 12% by FY32 and 3.5% by FY36 as the AI build-out matures. FY32 revenue of this line is about 7x FY26; there is no public company target beyond FY27 to check that against, so it is the model's own assumption. Limitation: Lumentum discloses no unit shipments, average selling prices or capacity for laser chips, assemblies, line subsystems or data transport; the 10-K gives revenue by type of product and the share of growth each product family contributed, so no volume x price build is possible. Product-line splits it used to publish (datacom, telecom, industrial) are not reported for FY2026.
Read the workbook’s historical source annotation
SEC Form 10-K for fiscal year ended 2026-06-27, filed 2026-08-17, Note 18 - Revenue Recognition (net revenue by type of product), p. 124; MD&A Financial Data table, p. 50
Systems (optical modules, optical circuit switches, industrial lasers)
Mechanism: Revenue: growth % reached by end of stage
Inputs shown in this file: FY27E: 113.0% · FY28E: 58.0% · FY29E-FY32E: 15.0% · FY33E-FY36E: 4.0%
Read this driver’s forecast rationale
FY26 Systems revenue was $1,008.4mm, up 90.7%; cloud transceiver lines grew by more than 173% on shipment volume, partly offset by lower selling prices, and optical circuit switches (OCS) contributed more than $90.0mm in their initial phase of shipments (SEC Form 10-K for fiscal year ended 2026-06-27, filed 2026-08-17, MD&A, Net Revenue). Q4 FY26 Systems revenue was $356.9mm, +29.7% on Q3 and +122.6% on Q4 FY25 (Q4 FY2026 earnings release (Form 8-K Exhibit 99.1) filed 2026-08-11); the release says OCS and 1.6T cloud modules are 'beginning to layer in'. Before FY26 the company reported Cloud & Networking ($1,084.9mm in FY24, $1,410.8mm in FY25) and Industrial Tech ($274.3mm and $234.2mm) (SEC Form 10-K for fiscal year ended 2025-06-28, filed 2025-08-19, MD&A, Segment net revenue); that split ended with the first-quarter FY26 reorganisation into one reporting segment (SEC Form 10-K for fiscal year ended 2026-06-27, filed 2026-08-17, Note 17). Assumption: growth of about 113% in FY27 and 58% in FY28 (OCS and 1.6T module ramps, Q1 FY27 total revenue guided to $1.225-1.275bn) puts total revenue within 5% of consensus; growth then fades to 15% by FY32 and 4% by FY36 as module prices keep falling. Limitation: Lumentum discloses no module unit shipments, port counts, bandwidth or average selling prices (the 10-K says only that transceiver prices fell), and gives OCS revenue only as 'more than $90.0 million' for FY26 with no earlier history; the old Cloud & Networking and Industrial Tech split has no FY2026 figure, so it cannot give three years of history.
Read the workbook’s historical source annotation
SEC Form 10-K for fiscal year ended 2026-06-27, filed 2026-08-17, Note 18 - Revenue Recognition (net revenue by type of product), p. 124; MD&A Financial Data table, p. 50
The later forecast years contain modeling judgments. The historical labels, financial-period dates and valuation date are separate from any stock-price observation; this page does not supply a current market quote.
One company. One year of access.
Your US$19.99 one-time purchase includes 12 months of downloads and updates for this company’s model. No automatic renewal. Downloaded files remain usable after access ends; no fixed update cadence is promised.
Read the current version’s notes
USD in millions, fiscal year ending Saturday nearest 30 June (FY2026 ended 27 June 2026; FY2027 ends 3 July 2027, a 53-week year; modelled as 30 June). Base case: FY2027E and FY2028E revenue are set to land within 5% of analyst consensus; later years are this model's own assumptions, each explained in the last column.
Dates and descriptions reflect this workbook’s notes. They are not a claim of independent audit or a guarantee that its forecasts will occur.