GE Vernova Excel edition
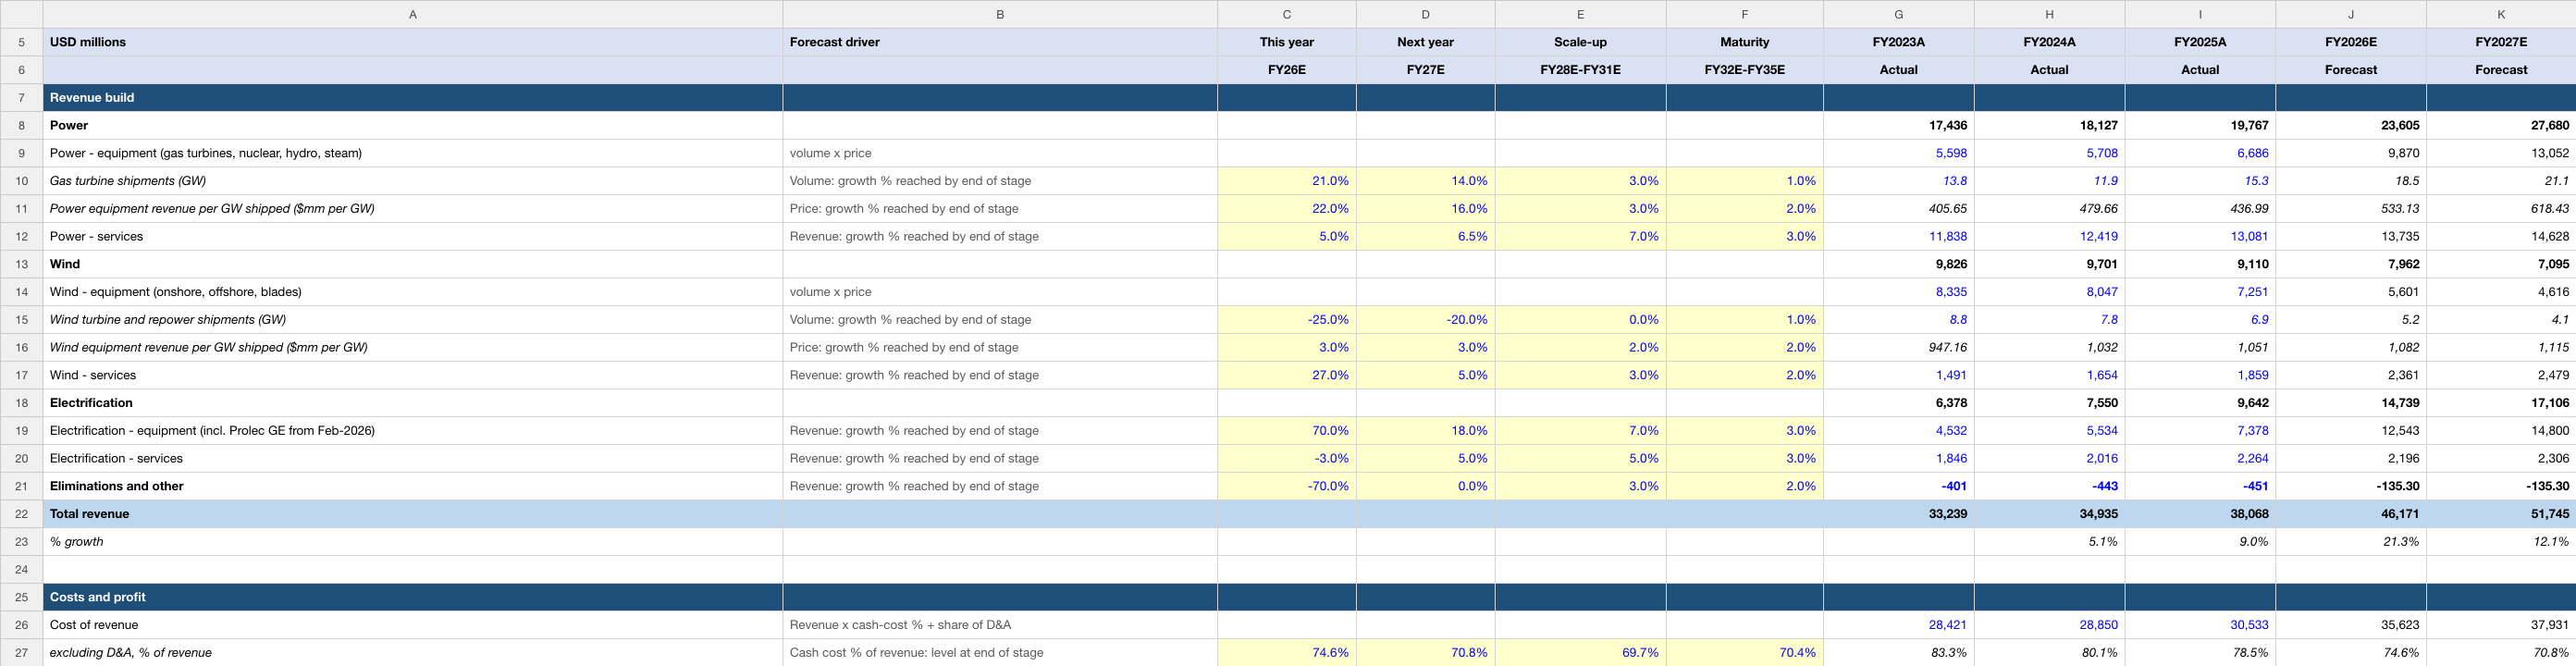
Gas and wind turbine GW shipped, revenue per GW, services and Electrification. Change the highlighted assumptions to explore the relationship between operating performance, cash flow and value.
Inside the workbook
- Income Statement, Balance Sheet, Cash Flow and DCF Valuation worksheets.
- Three historical fiscal years and ten modeled periods with source and forecast notes.
- Discounted cash flows, terminal-value methods and valuation sensitivities.
| Edition detail | Included |
|---|---|
| Valuation date | 5 October 2026 |
| Historical periods | FY2023A, FY2024A, FY2025A |
| Modeled periods | FY2026E–FY2035E |
| Financial currency | USD in millions |
| Format | Editable .xlsx · Four worksheets · 53.8 KB |
| Price | US$19.99 for 12 months of company-model access |
Historical figures recorded in this edition
These are cached historical entries in the uploaded GE Vernova workbook, dated 5 October 2026. Fiscal-year labels and units follow the file; they are not live data. The source annotations below are the model author’s references, rather than an independent audit of every figure.
| Metric | FY2023A | FY2024A | FY2025A |
|---|---|---|---|
| Total revenue | 33,239.00 | 34,935.00 | 38,068.00 |
| Operating income (EBIT) | -923.00 | 471.00 | 1,388.00 |
| Net income | -438.00 | 1,552.00 | 4,884.00 |
How this edition builds the forecast
Gas and wind turbine GW shipped, revenue per GW, services and Electrification. The first forecast period is FY2026E. The editable assumptions distinguish the operating driver from the reasoning used to forecast it.
Gas turbine shipments (GW)
Mechanism: Volume: growth % reached by end of stage
Inputs shown in this file: FY26E: 21.0% · FY27E: 14.0% · FY28E-FY31E: 3.0% · FY32E-FY35E: 1.0%
Read this driver’s forecast rationale
Shipments were 11.9 GW in FY24 and 15.3 GW in FY25 (SEC Form 10-K for the year ended 2025-12-31, filed 2026-01-29); 1H26 was 7.5 GW against 8.2 GW in 1H25, with only 3.3 GW in 2Q26 (SEC Form 10-Q for quarter ended 2026-06-30, filed 2026-07-22, MD&A - Power). Management says it is on track to reach an annualised 20 GW of gas turbine output in 3Q26, 24 GW in 2028 and is acting to produce 30 GW in 2030, and gas equipment backlog plus slot reservation agreements rose from 100 to 116 GW in 2Q26 with at least 125 GW expected by year-end (GE Vernova second-quarter 2026 earnings release (8-K Exhibit 99, filed 2026-07-22)). Assumption: 7.5 GW in 1H26 and ~11 GW in 2H26 give ~18.5 GW (+21%); +14% in FY27 (~21 GW); FY28 lands just under the 24 GW target and FY30 (~27 GW) stays below the 30 GW aspiration; growth then fades to 1%.
Read the workbook’s historical source annotation
SEC Form 10-K for the year ended 2025-12-31, filed 2026-01-29, MD&A - Power, 'Sales in units': gas turbine gigawatts 13.8 / 11.9 / 15.3 (FY2023 / FY2024 / FY2025); FY2023 and FY2024 also in SEC Form 10-K for the year ended 2024-12-31, filed 2025-02-06 (includes the carve-out combined financial statements for FY2023, prepared before the Spin-Off on 2024-04-02)
Power equipment revenue per GW shipped ($mm per GW)
Mechanism: Price: growth % reached by end of stage
Inputs shown in this file: FY26E: 22.0% · FY27E: 16.0% · FY28E-FY31E: 3.0% · FY32E-FY35E: 2.0%
Read this driver’s forecast rationale
Revenue per GW shipped was $406mm / $480mm / $437mm in FY23-FY25; 1H26 Power equipment revenue of $3,851mm on 7.5 GW is ~$513mm (SEC Form 10-Q for quarter ended 2026-06-30, filed 2026-07-22, MD&A - Power). The backlog points higher: Power equipment RPO was $24.7bn against 40 GW of gas backlog at Dec-2025 (SEC Form 10-K for the year ended 2025-12-31, filed 2026-01-29; GE Vernova fourth-quarter and full-year 2025 earnings release (8-K Exhibit 99, filed 2026-01-28)) and $39.3bn against 53 GW at Jun-2026 (SEC Form 10-Q for quarter ended 2026-06-30, filed 2026-07-22; GE Vernova second-quarter 2026 earnings release (8-K Exhibit 99, filed 2026-07-22)), about $620mm and $740mm per GW of backlog (these totals include non-gas equipment). Assumption: +22% in FY26 (~$533mm), +16% in FY27 as backlog converts at higher prices, growth fading to 3% by FY31 and 2% at maturity.
Power - services
Mechanism: Revenue: growth % reached by end of stage
Inputs shown in this file: FY26E: 5.0% · FY27E: 6.5% · FY28E-FY31E: 7.0% · FY32E-FY35E: 3.0%
Read this driver’s forecast rationale
Services revenue was $13,081mm in FY25 (+5%) (SEC Form 10-K for the year ended 2025-12-31, filed 2026-01-29); 1H26 was $6,598mm against $6,238mm in 1H25 (+6%) (SEC Form 10-Q for quarter ended 2026-06-30, filed 2026-07-22, MD&A - Power). Power services RPO was $69.7bn at Dec-2025 and $72.4bn at Jun-2026 (SEC Form 10-K for the year ended 2025-12-31, filed 2026-01-29; SEC Form 10-Q for quarter ended 2026-06-30, filed 2026-07-22), about five years of services revenue. Assumption: +5% in FY26, +6.5% in FY27 and ~7% to FY31 as the ~15 GW shipped in FY25 and ~18 GW in FY26 join the installed base, then fading to 3%. Limitation: Only the installed base at one date is disclosed (about 7,000 gas turbines, about 1,800 under long-term service agreements, SEC Form 10-K for the year ended 2025-12-31, filed 2026-01-29, Item 1) and no history of units under contract, so services cannot be built from units; the services RPO is the only forward marker.
Read the workbook’s historical source annotation
SEC Form 10-K for the year ended 2025-12-31, filed 2026-01-29, MD&A - Power, 'Segment revenues and EBITDA' table (equipment / services), p. 27; FY2023 in SEC Form 10-K for the year ended 2024-12-31, filed 2025-02-06 (includes the carve-out combined financial statements for FY2023, prepared before the Spin-Off on 2024-04-02) and in the same SEC Form 10-K for the year ended 2025-12-31, filed 2026-01-29 table
The later forecast years contain modeling judgments. The historical labels, financial-period dates and valuation date are separate from any stock-price observation; this page does not supply a current market quote.
One company. One year of access.
Your US$19.99 one-time purchase includes 12 months of downloads and updates for this company’s model. No automatic renewal. Downloaded files remain usable after access ends; no fixed update cadence is promised.
Read the current version’s notes
USD in millions, fiscal year ending December 31. Base case: FY2026E follows the company's published 2026 guidance and the reported first half; FY2027E revenue is set within 5% of analyst consensus; later years are this model's own assumptions, each explained in the last column. Spun off from GE on 2 April 2024: FY2023 is from the carve-out (combined) financial statements. History is as filed in the FY2025 annual report; from 1 January 2026 the company realigned some business units, which moved about $0.05bn of 1H25 revenue into Power and $0.08bn out of Electrification (SEC Form 10-Q for quarter ended 2025-06-30, filed 2025-07-23 against SEC Form 10-Q for quarter ended 2026-06-30, filed 2026-07-22), too small to restate.
Dates and descriptions reflect this workbook’s notes. They are not a claim of independent audit or a guarantee that its forecasts will occur.