Eaton Excel edition
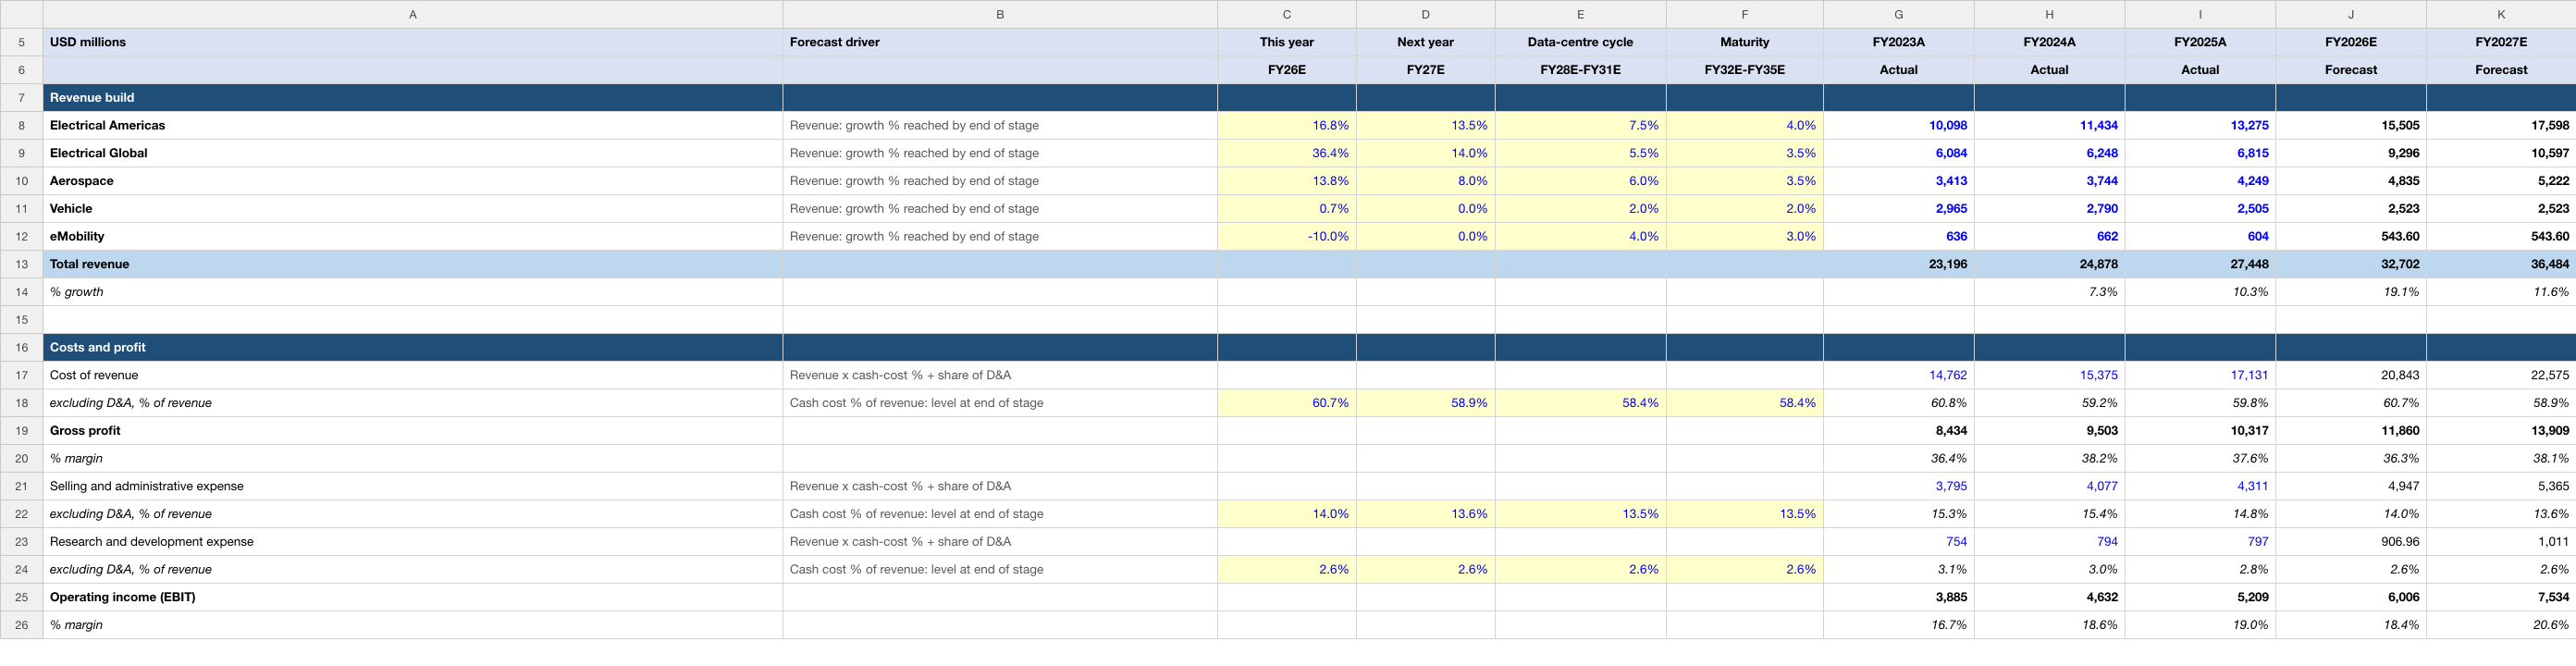
Electrical Americas and Global, Aerospace, Vehicle and eMobility segment revenue. Change the highlighted assumptions to explore the relationship between operating performance, cash flow and value.
Inside the workbook
- Income Statement, Balance Sheet, Cash Flow and DCF Valuation worksheets.
- Three historical fiscal years and ten modeled periods with source and forecast notes.
- Discounted cash flows, terminal-value methods and valuation sensitivities.
| Edition detail | Included |
|---|---|
| Valuation date | 5 October 2026 |
| Historical periods | FY2023A, FY2024A, FY2025A |
| Modeled periods | FY2026E–FY2035E |
| Financial currency | USD in millions |
| Format | Editable .xlsx · Four worksheets · 50.9 KB |
| Price | US$19.99 for 12 months of company-model access |
Historical figures recorded in this edition
These are cached historical entries in the uploaded Eaton workbook, dated 5 October 2026. Fiscal-year labels and units follow the file; they are not live data. The source annotations below are the model author’s references, rather than an independent audit of every figure.
| Metric | FY2023A | FY2024A | FY2025A |
|---|---|---|---|
| Total revenue | 23,196.00 | 24,878.00 | 27,448.00 |
| Operating income (EBIT) | 3,885.00 | 4,632.00 | 5,209.00 |
| Net income | 3,218.00 | 3,794.00 | 4,087.00 |
How this edition builds the forecast
Electrical Americas and Global, Aerospace, Vehicle and eMobility segment revenue. The first forecast period is FY2026E. The editable assumptions distinguish the operating driver from the reasoning used to forecast it.
Electrical Americas
Mechanism: Revenue: growth % reached by end of stage
Inputs shown in this file: FY26E: 16.8% · FY27E: 13.5% · FY28E-FY31E: 7.5% · FY32E-FY35E: 4.0%
Read this driver’s forecast rationale
Sales were $13,276mm in FY25, up 16% (organic +12%, acquisitions +4%), with backlog of $13,246mm (+31%), organic orders +16% and book-to-bill 1.2; data-centre demand was the main driver (SEC Form 10-K for the year ended 2025-12-31, filed 2026-02-26, MD&A Electrical Americas). In 2Q26 sales rose 18% organically on data centre and machine OEM demand, backlog was $15,175mm (+33%), TTM orders were +41% organically and book-to-bill was 1.3 (SEC Form 10-Q for the quarter ended 2026-06-30, filed 2026-07-31, MD&A; Earnings release (8-K Exhibit 99) for the quarter ended 2026-06-30, furnished 2026-07-31). Six months to June 2026 sales were $7,551mm (+19%). Company guidance for FY26 is 11-13% organic growth for Eaton as a whole and 13.5-15.5% for 3Q (Earnings release (8-K Exhibit 99) for the quarter ended 2026-06-30, furnished 2026-07-31). Assumption: ~+17% in FY26 (the second half grows ~15% on the orders and backlog above), +13.5% in FY27 (sized so total revenue lands on consensus of $36.6bn, with the order book still growing faster than sales), then growth fades to 7.5% by FY31 as the data-centre build-out matures and to 4% by FY35. Check: FY28-FY31 growth averages ~9.8%, below the 13% and 12% organic growth of FY24 and FY25 (SEC Form 10-K for the year ended 2025-12-31, filed 2026-02-26) and the 16% of 1H26 (SEC Form 10-Q for the quarter ended 2026-06-30, filed 2026-07-31). Limitation: Eaton does not report units, volumes or prices. Backlog and orders are disclosed in dollars (backlog) and as percentage changes (organic orders, book-to-bill), and organic growth mixes volume, price and mix, so no volume x price build is possible without inventing an operating metric; backlog, orders and organic growth are used as the evidence for the growth rate instead.
Read the workbook’s historical source annotation
SEC Form 10-K for the year ended 2025-12-31, filed 2026-02-26, Note 18 Business Segment Information, p. 75 (2024 and 2025 lines are typed 2 and 1 below the printed figures: the printed segment lines sum 2 and 1 above the printed total net sales of 24,878 and 27,448, a rounding difference)
Electrical Global
Mechanism: Revenue: growth % reached by end of stage
Inputs shown in this file: FY26E: 36.4% · FY27E: 14.0% · FY28E-FY31E: 5.5% · FY32E-FY35E: 3.5%
Read this driver’s forecast rationale
Sales were $6,815mm in FY25, up 9% (organic +7%, currency +2%); backlog $2,034mm (+19%), organic orders +6%, book-to-bill 1.0 (SEC Form 10-K for the year ended 2025-12-31, filed 2026-02-26, MD&A Electrical Global). Boyd Thermal (closed 12-Mar-2026, $9.55bn net of cash) added $524mm of sales to 30-Jun-2026, of which $92mm to 31-Mar (SEC Form 10-Q for the quarter ended 2026-06-30, filed 2026-07-31, Note 2; SEC Form 10-Q for the quarter ended 2026-03-31, filed 2026-05-05, Note 2), i.e. ~$432mm in 2Q or a run-rate of ~$1.7bn a year. 2Q26 sales were $2,517mm (+44%: organic +18%, Boyd +25%); backlog $3,602mm (+103%, organic +54%), TTM orders +33% organically (SEC Form 10-Q for the quarter ended 2026-06-30, filed 2026-07-31; Earnings release (8-K Exhibit 99) for the quarter ended 2026-06-30, furnished 2026-07-31). Assumption: FY26 +36% (organic ~+14%, Boyd ~+21%, currency ~+1%); FY27 +14% (organic ~10% plus ~4% for the 2.4 extra months of Boyd, Jan-to-mid-Mar); then growth fades to 5.5% by FY31 and 3.5% by FY35. Check: FY28-FY31 growth averages ~8.7%, against organic growth of 4% and 7% in FY24 and FY25 (SEC Form 10-K for the year ended 2025-12-31, filed 2026-02-26) and 14% in 1H26 (SEC Form 10-Q for the quarter ended 2026-06-30, filed 2026-07-31), so it sits between the two. Limitation: Eaton does not report units, volumes or prices. Backlog and orders are disclosed in dollars (backlog) and as percentage changes (organic orders, book-to-bill), and organic growth mixes volume, price and mix, so no volume x price build is possible without inventing an operating metric; backlog, orders and organic growth are used as the evidence for the growth rate instead.
Read the workbook’s historical source annotation
SEC Form 10-K for the year ended 2025-12-31, filed 2026-02-26, Note 18 Business Segment Information, p. 75
Aerospace
Mechanism: Revenue: growth % reached by end of stage
Inputs shown in this file: FY26E: 13.8% · FY27E: 8.0% · FY28E-FY31E: 6.0% · FY32E-FY35E: 3.5%
Read this driver’s forecast rationale
Sales were $4,249mm in FY25, up 13% (organic +12%), with backlog $4,316mm (+16%), organic orders +11% and book-to-bill 1.1 (SEC Form 10-K for the year ended 2025-12-31, filed 2026-02-26, MD&A Aerospace). Ultra PCS (closed 23-Jan-2026, $1.53bn) added $111mm of sales to June 2026 (SEC Form 10-Q for the quarter ended 2026-06-30, filed 2026-07-31, Note 2). 2Q26 sales were $1,222mm (+13%: organic +7%, Ultra +6%); backlog $5,164mm (+28%, organic +18%), TTM orders +17%, book-to-bill 1.2 (SEC Form 10-Q for the quarter ended 2026-06-30, filed 2026-07-31; Earnings release (8-K Exhibit 99) for the quarter ended 2026-06-30, furnished 2026-07-31). Six-month sales by market: OEM $864mm, aftermarket $920mm, industrial and other $578mm (SEC Form 10-Q for the quarter ended 2026-06-30, filed 2026-07-31, Note 3). Assumption: FY26 +14% (organic ~+8%, Ultra ~+6%), FY27 +8% (organic growth with the order book growing faster than sales), then fading to 6% by FY31 and 3.5% by FY35. Check: FY28-FY31 growth averages ~6.8%, below the 10% and 12% organic growth of FY24 and FY25 (SEC Form 10-K for the year ended 2025-12-31, filed 2026-02-26). Limitation: Eaton reports no aircraft deliveries, shipsets or flight hours for Aerospace; backlog is in dollars and orders only as percentage changes, so growth is a plain rate.
Read the workbook’s historical source annotation
SEC Form 10-K for the year ended 2025-12-31, filed 2026-02-26, Note 18 Business Segment Information, p. 75
The later forecast years contain modeling judgments. The historical labels, financial-period dates and valuation date are separate from any stock-price observation; this page does not supply a current market quote.
One company. One year of access.
Your US$19.99 one-time purchase includes 12 months of downloads and updates for this company’s model. No automatic renewal. Downloaded files remain usable after access ends; no fixed update cadence is promised.
Read the current version’s notes
USD in millions, fiscal year ending December 31. Base case: FY2026E is built from six months reported to 30-Jun-2026 and company guidance, and FY2026E-FY2027E revenue lands on analyst consensus; later years are this model's own assumptions, each explained in the last column. The Mobility separation and the COL Group purchase have not closed and are not modelled.
Dates and descriptions reflect this workbook’s notes. They are not a claim of independent audit or a guarantee that its forecasts will occur.