Constellation Energy Excel edition
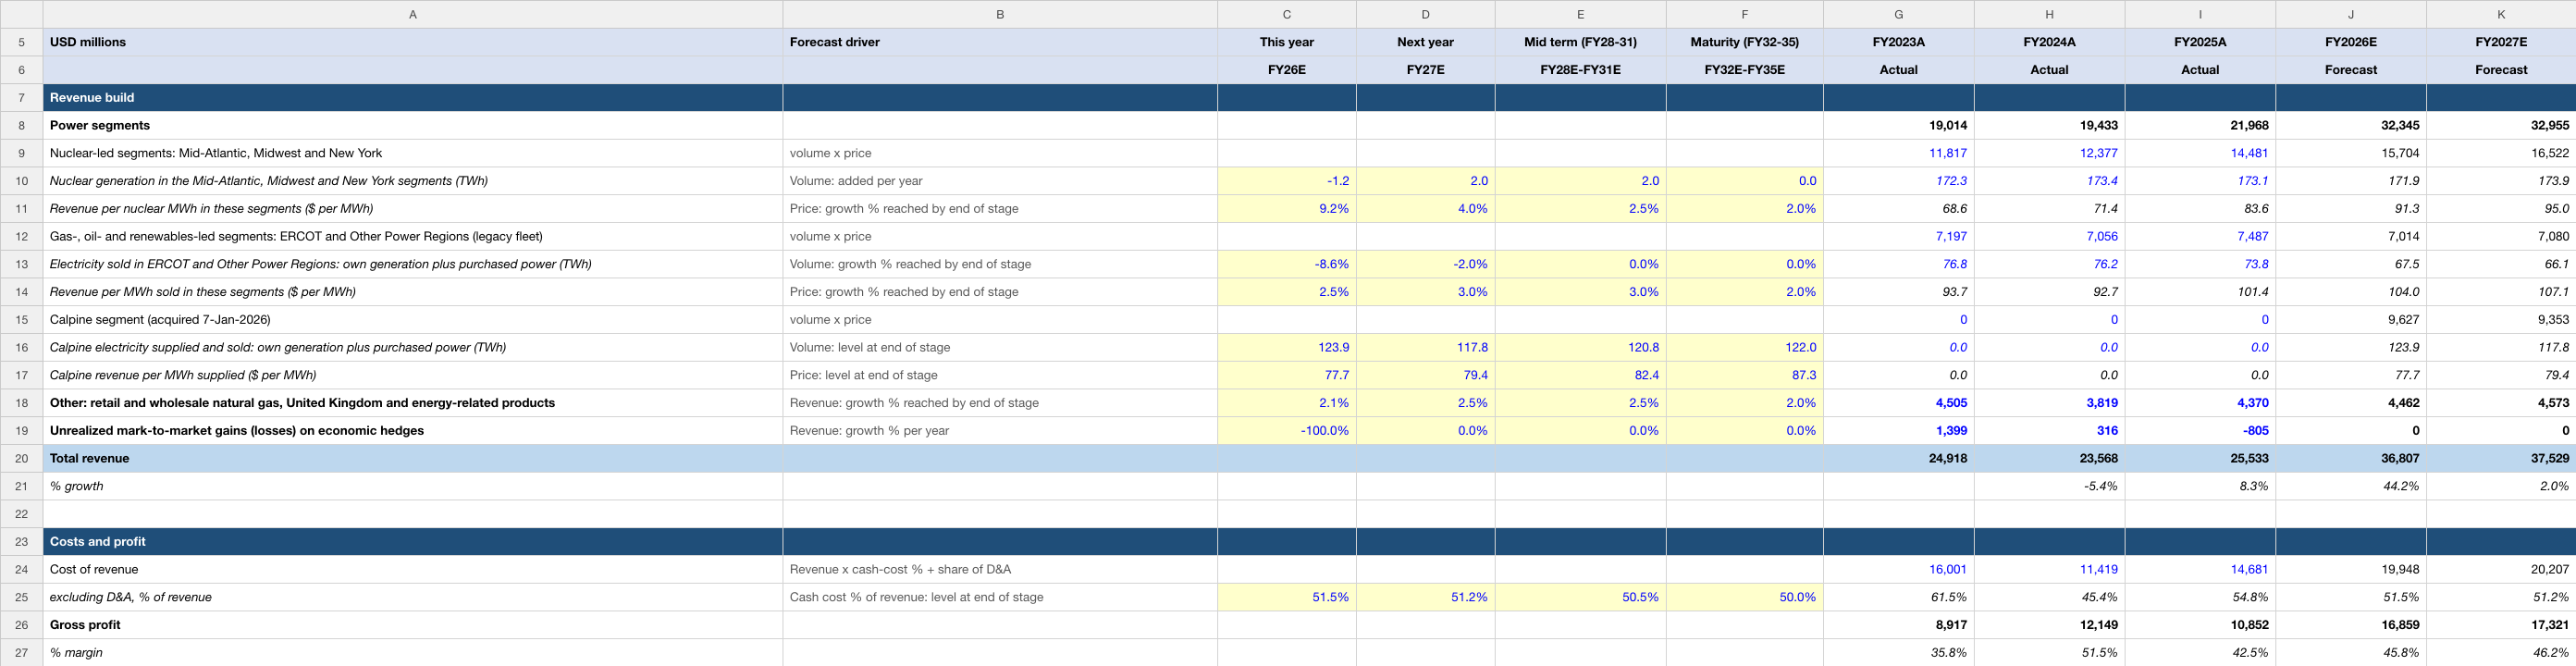
Nuclear, ERCOT and Calpine generation volumes and revenue per MWh. Change the highlighted assumptions to explore the relationship between operating performance, cash flow and value.
Inside the workbook
- Income Statement, Balance Sheet, Cash Flow and DCF Valuation worksheets.
- Three historical fiscal years and ten modeled periods with source and forecast notes.
- Discounted cash flows, terminal-value methods and valuation sensitivities.
| Edition detail | Included |
|---|---|
| Valuation date | 5 October 2026 |
| Historical periods | FY2023A, FY2024A, FY2025A |
| Modeled periods | FY2026E–FY2035E |
| Financial currency | USD in millions |
| Format | Editable .xlsx · Four worksheets · 61.4 KB |
| Price | US$19.99 for 12 months of company-model access |
Historical figures recorded in this edition
These are cached historical entries in the uploaded Constellation Energy workbook, dated 5 October 2026. Fiscal-year labels and units follow the file; they are not live data. The source annotations below are the model author’s references, rather than an independent audit of every figure.
| Metric | FY2023A | FY2024A | FY2025A |
|---|---|---|---|
| Total revenue | 24,918.00 | 23,568.00 | 25,533.00 |
| Operating income (EBIT) | 1,610.00 | 4,352.00 | 3,086.00 |
| Net income | 1,623.00 | 3,749.00 | 2,319.00 |
How this edition builds the forecast
Nuclear, ERCOT and Calpine generation volumes and revenue per MWh. The first forecast period is FY2026E. The editable assumptions distinguish the operating driver from the reasoning used to forecast it.
Nuclear generation in the Mid-Atlantic, Midwest and New York segments (TWh)
Mechanism: Volume: added per year
Inputs shown in this file: FY26E: -1.2 · FY27E: 2 · FY28E-FY31E: 2 · FY32E-FY35E: 0
Read this driver’s forecast rationale
Output in these three segments was 172.3 / 173.4 / 173.1 TWh in FY23-FY25 at nuclear fleet capacity factors of 94.4% / 94.6% / 94.7% (SEC Form 10-K for the year ended 2025-12-31, filed 2026-02-24, MD&A) and 84.4 TWh in 1H26 vs 85.7 TWh in 1H25 as fleet refueling outage days rose to 185 from 129 (SEC Form 10-Q for the quarter ended 2026-06-30, filed 2026-08-06, MD&A Nuclear Fleet Capacity Factor). The company publishes total nuclear volumes, at ownership share and including Salem and STP, of 179 / 184 / 190 / 188 / 189 million MWh for 2026-2030, with 15 / 15 / 13 / 15 / 14 planned refueling outages (SEC Form 8-K filed 2026-08-06, Exhibit 99.2 (second-quarter 2026 earnings conference call presentation), Detailed Modeling Inputs for Base Earnings). Salem is inside the Mid-Atlantic figure here; STP (ERCOT, 9.6 TWh in FY25) is not, so the comparable company totals are those less STP: about 180 / 178 / 179 TWh for FY28-FY30 with STP held at its FY25 output. Assumption: -1.2 TWh in FY26 (2H at about last year's 87.4 TWh; with STP at about 9 TWh that is about 181 TWh against the company's 179), +2.0 TWh in FY27 as the 835 MW Crane Clean Energy Center restart, planned for 2027 (SEC Form 8-K filed 2026-08-06, Exhibit 99.1 (second-quarter 2026 earnings release)), and uprates begin (173.9 TWh, about 183.5 with STP against 184), then +2.0 TWh a year to FY31: 175.9 / 177.9 / 179.9 TWh in FY28-FY30, which is -4.5 / -0.5 / +0.5 TWh against the company's totals less STP. The additions are Crane's first full year (about 6.7 TWh at a 92% capacity factor), the 30 MW Clinton (SEC Form 10-K for the year ended 2025-12-31, filed 2026-02-24) and 30 MW Dresden (SEC Form 10-Q for the quarter ended 2026-06-30, filed 2026-08-06) uprates and part of the roughly 1,100 MW of uprates the fleet is positioned for, 900 MW of them possible with customer support (SEC Form 8-K filed 2026-08-06, Exhibit 99.2 (second-quarter 2026 earnings conference call presentation)). Flat at maturity at 181.9 TWh, 2.5 TWh (1.4%) above the company's 2030 total less STP. The company's year-to-year pattern (190 / 188 / 189, following its outage schedule) is not modelled; the path is smooth.
Read the workbook’s historical source annotation
SEC Form 10-K for the year ended 2025-12-31, filed 2026-02-24 and SEC Form 10-K for the year ended 2024-12-31, filed 2025-02-18, MD&A Sales and Supply Sources, nuclear generation at ownership share (GWh): Mid-Atlantic 53,012 / 52,898 / 52,914, Midwest 93,768 / 95,321 / 93,866, New York 25,546 / 25,134 / 26,339 for 2023 / 2024 / 2025. ERCOT nuclear output (South Texas Project: 1,721 / 8,358 / 9,571 GWh) belongs to the ERCOT segment and is not counted here
Revenue per nuclear MWh in these segments ($ per MWh)
Mechanism: Price: growth % reached by end of stage
Inputs shown in this file: FY26E: 9.2% · FY27E: 4.0% · FY28E-FY31E: 2.5% · FY32E-FY35E: 2.0%
Read this driver’s forecast rationale
Revenue per nuclear MWh was $68.6 / $71.4 / $83.6 in FY23-FY25 and $92.8 in 1H26 vs $83.3 in 1H25 (segment revenue over nuclear TWh; SEC Form 10-K for the year ended 2025-12-31, filed 2026-02-24 Note 5, SEC Form 10-Q for the quarter ended 2026-06-30, filed 2026-08-06 MD&A). Capacity prices drive part of this: PJM Eastern MAAC averaged $179.79/MW-day in 2025 vs $51.89 in 2024 (SEC Form 10-K for the year ended 2025-12-31, filed 2026-02-24) and $279.80 in 1H26 (SEC Form 10-Q for the quarter ended 2026-06-30, filed 2026-08-06); the 2028/29 auction cleared all 15,700 MW of Constellation's PJM nuclear at the $325/MW-day cap, about $1.9bn a year, or about $12.7 per MWh of the Mid-Atlantic and Midwest segments' nuclear output (SEC Form 8-K filed 2026-07-14 (PJM 2028/2029 capacity auction results)), and the cap and a $175 floor also apply to the 2029/30 auction (SEC Form 10-Q for the quarter ended 2026-06-30, filed 2026-08-06, MD&A PJM Market Reform). The nuclear production tax credit under the Inflation Reduction Act is the floor: up to $15/MWh, phased out as gross receipts per MWh rise between $26.00 and $44.75 (capacity revenue counts as receipts; SEC Form 8-K filed 2026-07-14 (PJM 2028/2029 capacity auction results)), through 2032 and inflation-indexed (SEC Form 10-K for the year ended 2025-12-31, filed 2026-02-24, MD&A and Note 6). It was worth $2,080mm in FY24, $320mm in FY25 and was immaterial in 1H26 because prices are above the phase-out (SEC Form 10-Q for the quarter ended 2026-06-30, filed 2026-08-06, Note 6), so it caps the downside rather than lifting the base case. Assumption: +9.2% in FY26 (the 1H26 gain of 11% with a smaller 2H gain), +4% in FY27 as the Illinois CMC programme (which reduced 1H26 revenue by about $400mm at current prices; SEC Form 10-Q for the quarter ended 2026-06-30, filed 2026-08-06) and ZEC programme expire in 2027 and the Meta agreement for Clinton starts in June 2027 (SEC Form 10-K for the year ended 2025-12-31, filed 2026-02-24), then growth fades to 2.5% by FY31 (capacity flat at the cap; repricing into hyperscaler agreements, including 920 MW signed for 2029-2032; SEC Form 8-K filed 2026-08-06, Exhibit 99.1 (second-quarter 2026 earnings release)) and 2.0% by FY35. Mid-term check against company targets (SEC Form 8-K filed 2026-08-06, Exhibit 99.2 (second-quarter 2026 earnings conference call presentation)): the company's base case (contracts and PTC floor, no market upside) prices contracted clean volumes of 36 / 45 / 53 / 54 / 53 million MWh at $70.00 / $70.00 / $77.00 / $85.00 / $88.00 per MWh for 2026-2030 (PPAs signed in 2026 are not yet in them) and the remaining nuclear units at a PTC floor of $44.75 / $45.75 / $48.88 / $49.88 / $50.88; weighted by their published volumes, that base price rises $9.3 per MWh from 2027 to 2029 and $10.7 to 2030. The path here rises $6.6 and $9.6 over the same years, so it is $2.7 per MWh (about $0.5bn of FY29 revenue) and $1.1 per MWh behind. It is kept because the base path is a floor that leaves out market prices and its 2028 step includes the end of the Illinois CMC programme in mid-2027, which FY27's +4% already carries. The 2029 outlook (SEC Form 8-K filed 2026-08-06, Exhibit 99.2 (second-quarter 2026 earnings conference call presentation)) is base adjusted EPS of $11.40-$11.90, with enhanced earnings at 30%-35% of the total (about $16-$18 in total), base EPS growth of 20%+ a year from 2026 to 2029, and free cash flow before growth (FCFbG) of $8.4bn for 2026-27 and $11.5-$13.0bn for 2028-29. FY29 net income here is 5,135, $14.5 a share on 355mm shares: 22%-27% above the base outlook and 11%-21% below the implied total, a gap of $0.6-$1.4bn of net income. That gap is the enhanced layer (forward power prices above the base assumptions, commercial margins above their 10-year average, volatility), which depends on markets and is not guided in dollars. This model's revenue per MWh is market-realized rather than floor-priced, so part of that layer is already in it: net income is $2.8 a share above the base midpoint, about 50% of the roughly $5.6 enhanced layer. The rest is not added. The 20%+ base growth is also not copied: it is growth on a floor-based measure, and net income here grows 5.6% a year from FY27 to FY29 from a FY27 level of $13.0 a share, which sits just above the top of the $11.7-$12.8 implied for 2027 by base EPS of $7.60-$7.70 at 35%-40% enhanced (the model's FY27 D&A is about $0.4bn below the company's, worth about $0.9 a share; see the D&A basis). Share repurchases lift the company's EPS but not this model's net income (it holds 355mm shares). Because cost lines are ratios of revenue, repricing earns the average margin here rather than the near-full drop-through of a contract price rise; that, with the enhanced layer, is the part of the company's outlook this forecast leaves out.
Electricity sold in ERCOT and Other Power Regions: own generation plus purchased power (TWh)
Mechanism: Volume: growth % reached by end of stage
Inputs shown in this file: FY26E: -8.6% · FY27E: -2.0% · FY28E-FY31E: 0.0% · FY32E-FY35E: 0.0%
Read this driver’s forecast rationale
Volumes fell from 76.8 TWh (FY23) to 73.8 TWh (FY25); 1H26 was 32.5 TWh vs 36.8 TWh in 1H25 (-11.5%), mainly lower load in New England (Other Power Regions revenue -10.4% in 1H26; SEC Form 10-Q for the quarter ended 2026-06-30, filed 2026-08-06, MD&A). Own gas, oil and renewables generation here is about 19 TWh a year (FY25: ERCOT 12.9, Other Power Regions 6.2; SEC Form 10-K for the year ended 2025-12-31, filed 2026-02-24) and the rest is purchased power sold to customers. Calpine's much larger gas fleet is modelled separately below. Assumption: -8.6% in FY26 (1H26 -11.5% with a smaller fall in 2H), -2% in FY27, then the decline fades to flat by FY31.
Read the workbook’s historical source annotation
SEC Form 10-K for the year ended 2025-12-31, filed 2026-02-24 and SEC Form 10-K for the year ended 2024-12-31, filed 2025-02-18, MD&A Sales and Supply Sources, Total Supply/Sales by Region (GWh): ERCOT 24,128 / 26,385 / 25,532 and Other Power Regions 52,704 / 49,769 / 48,288 for 2023 / 2024 / 2025
The later forecast years contain modeling judgments. The historical labels, financial-period dates and valuation date are separate from any stock-price observation; this page does not supply a current market quote.
One company. One year of access.
Your US$19.99 one-time purchase includes 12 months of downloads and updates for this company’s model. No automatic renewal. Downloaded files remain usable after access ends; no fixed update cadence is promised.
Read the current version’s notes
USD in millions, fiscal year ending December 31. Base case: history (FY2023-FY2025) is pre-Calpine; Calpine (closed 7-Jan-2026) is its own volume x price line from FY2026. FY2026E (first half reported) and FY2027E revenue land near analyst consensus; revenue is on a realized basis, so unrealized mark-to-market gains and losses are excluded from the forecast. Later years are this model's own assumptions, each explained in the last column. Mid-term check against the company's published targets (8-K Exhibit 99.2): nuclear volumes follow its 2028-2030 totals less South Texas Project, and capex drops to a sustaining level once the $3.9bn growth programme ends in FY27. FY29 net income of about $5.1bn ($14.5 a share) is above the company's base 2029 EPS outlook of $11.40-$11.90 and below the roughly $16-$18 that adding its enhanced earnings (30%-35% of the total) implies; enhanced earnings depend on market prices and are not guided in dollars, and model free cash flow, with deferred taxes modelled, is about 70% of the company's 2028-29 free cash flow before growth (basis of revenue per nuclear MWh and of capex).
Dates and descriptions reflect this workbook’s notes. They are not a claim of independent audit or a guarantee that its forecasts will occur.