Coherent Excel edition
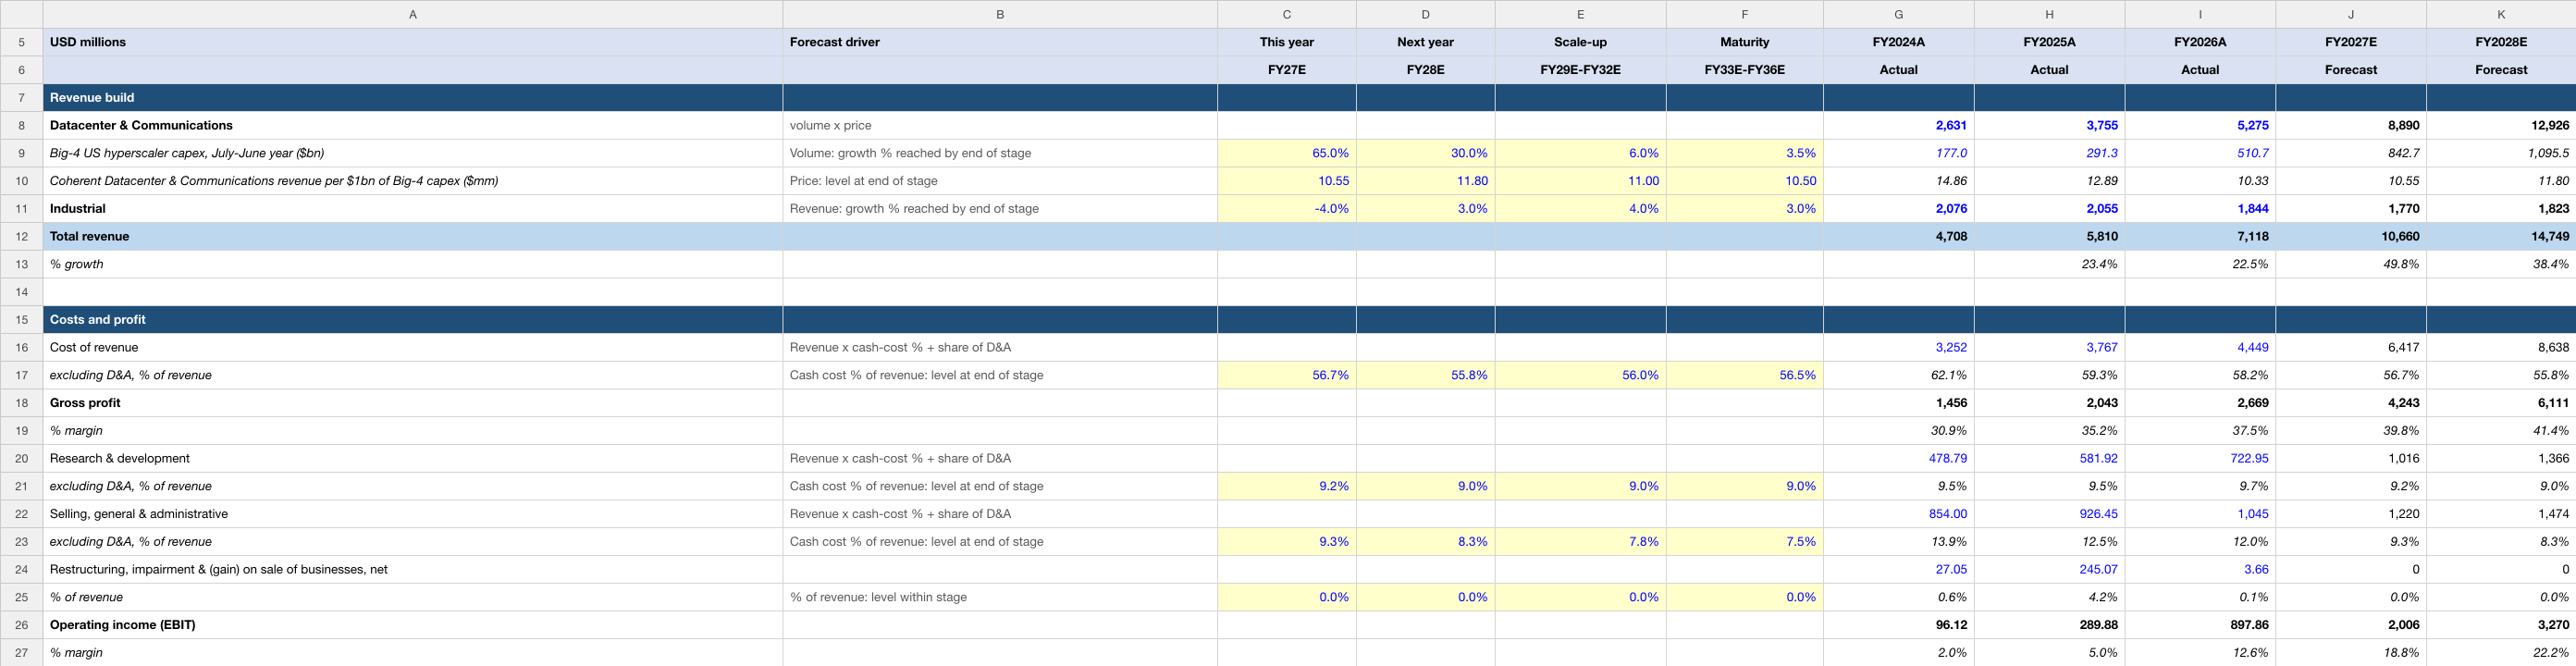
Datacenter & Communications revenue per $1bn of hyperscaler capex, plus Industrial. Change the highlighted assumptions to explore the relationship between operating performance, cash flow and value.
Inside the workbook
- Income Statement, Balance Sheet, Cash Flow and DCF Valuation worksheets.
- Three historical fiscal years and ten modeled periods with source and forecast notes.
- Discounted cash flows, terminal-value methods and valuation sensitivities.
| Edition detail | Included |
|---|---|
| Valuation date | 5 October 2026 |
| Historical periods | FY2024A, FY2025A, FY2026A |
| Modeled periods | FY2027E–FY2036E |
| Financial currency | USD in millions |
| Format | Editable .xlsx · Four worksheets · 47.7 KB |
| Price | US$19.99 for 12 months of company-model access |
Historical figures recorded in this edition
These are cached historical entries in the uploaded Coherent workbook, dated 5 October 2026. Fiscal-year labels and units follow the file; they are not live data. The source annotations below are the model author’s references, rather than an independent audit of every figure.
| Metric | FY2024A | FY2025A | FY2026A |
|---|---|---|---|
| Total revenue | 4,707.69 | 5,810.11 | 7,118.18 |
| Operating income (EBIT) | 96.12 | 289.88 | 897.86 |
| Net income | -156.15 | 49.36 | 805.00 |
How this edition builds the forecast
Datacenter & Communications revenue per $1bn of hyperscaler capex, plus Industrial. The first forecast period is FY2027E. The editable assumptions distinguish the operating driver from the reasoning used to forecast it.
Big-4 US hyperscaler capex, July-June year ($bn)
Mechanism: Volume: growth % reached by end of stage
Inputs shown in this file: FY27E: 65.0% · FY28E: 30.0% · FY29E-FY32E: 6.0% · FY33E-FY36E: 3.5%
Read this driver’s forecast rationale
Big-4 capex was $177bn, $291bn (+65%) and $511bn (+75%) in the July-June years FY24-FY26; the four spent $294.8bn in January-June 2026 and $165bn in the June quarter alone, a $660bn annual rate (hyperscaler cash-flow statements, purchases of (Microsoft: additions to) property and equipment: Amazon.com 10-Q for the quarter ended 2026-06-30 (filed 2026-07-31, twelve-months columns to June 2025 and June 2026) and 10-Q for the quarter ended 2024-06-30 (filed 2024-08-02, twelve months to June 2024); Alphabet 10-K FY2025 (filed 2026-02-05) and 10-Qs for the quarter ended 2026-06-30 (filed 2026-07-23) and 2024-06-30 (filed 2024-07-24); Meta Platforms 10-K FY2025 (filed 2026-01-29) and 10-Qs for the quarter ended 2026-06-30 (filed 2026-07-30) and 2024-06-30 (filed 2024-08-01); Microsoft 10-K FY2026 (filed 2026-07-29); quarterly capex of the four, from SEC XBRL cash-flow facts in the 10-Qs for the quarters ended 2025-12-31 (Microsoft, filed 2026-01-28), 2026-03-31 (Alphabet and Meta filed 2026-04-30, Microsoft 2026-04-29) and 2026-06-30 (Amazon, Alphabet, Meta; Microsoft 10-K FY2026)). Published plans: Amazon raised 2026 capex to $220bn (CNBC, 2026-07-30); Alphabet raised 2026 capex to as much as $190bn and expects a significant increase in 2027 (CNBC, 2026-04-29); analysts see Big Tech capex topping $1 trillion in 2027 (CNBC, 2026-04-30). Assumption: +65% in FY27 (~$843bn: second-half 2026 plus first-half 2027, from a $165bn quarterly run-rate that keeps rising), +30% in FY28 (~$1.1tn), then growth fading year by year to 6% in FY32 and 3.5% in FY36 (~$2.3tn).
Read the workbook’s historical source annotation
hyperscaler cash-flow statements, purchases of (Microsoft: additions to) property and equipment: Amazon.com 10-Q for the quarter ended 2026-06-30 (filed 2026-07-31, twelve-months columns to June 2025 and June 2026) and 10-Q for the quarter ended 2024-06-30 (filed 2024-08-02, twelve months to June 2024); Alphabet 10-K FY2025 (filed 2026-02-05) and 10-Qs for the quarter ended 2026-06-30 (filed 2026-07-23) and 2024-06-30 (filed 2024-07-24); Meta Platforms 10-K FY2025 (filed 2026-01-29) and 10-Qs for the quarter ended 2026-06-30 (filed 2026-07-30) and 2024-06-30 (filed 2024-08-01); Microsoft 10-K FY2026 (filed 2026-07-29). Terms: Amazon + Alphabet + Meta Platforms + Microsoft. Amazon: twelve months to June (its own twelve-month column). Alphabet and Meta: calendar year less January-June of that year plus January-June of the next (e.g. FY2026 = 2025 - H1 2025 + H1 2026). Microsoft: its own June fiscal year. Matches Coherent's July-June fiscal year.
Coherent Datacenter & Communications revenue per $1bn of Big-4 capex ($mm)
Mechanism: Price: level at end of stage
Inputs shown in this file: FY27E: 10.55 · FY28E: 11.8 · FY29E-FY32E: 11 · FY33E-FY36E: 10.5
Read this driver’s forecast rationale
Implied $14.9mm, $12.9mm and $10.3mm of segment revenue per $1bn of Big-4 capex in FY24-FY26: Big-4 capex grew faster than the segment, which also sells to telecom and to AI buyers outside the four. The FY27 and FY28 levels are what consensus revenue implies after Industrial (FY27 $10.6bn: Q1 FY27 guidance is $2.2-2.4bn, Q4 and full-year FY2026 earnings press release (Form 8-K exhibit 99.1, filed 2026-08-12); FY28 $14.8bn), so the FY28 rise of ~12% relies on the new growth engines the company lists (co-packaged optics, optical circuit switches, multi-rail transport, thermal solutions, with revenue starting between now and H2 2027), on internal InP laser output doubling by year-end and more than doubling again by 2027, and on $20bn+ of incremental serviceable market by calendar 2030 (Q4 FY2026 investor presentation, including its reconciliation tables (Form 8-K exhibit 99.2, filed 2026-08-12)), plus the multi-year NVIDIA supply agreement (SEC Form 10-K for fiscal year ended 2026-06-30 (FY2026), filed 2026-08-14, MD&A). This is the most aggressive assumption in the model. Assumption: the ratio then eases to 11.0 by FY32 and 10.5 by FY36 (about the FY26 level) as competition and customer in-sourcing absorb the content gains. Check against a public marker: FY30 segment revenue of ~$18bn would be about 37% of the $50bn+ serviceable market the company cites for calendar 2030 (Q4 FY2026 investor presentation, including its reconciliation tables (Form 8-K exhibit 99.2, filed 2026-08-12)); that market is a company estimate, not a revenue target.
Industrial
Mechanism: Revenue: growth % reached by end of stage
Inputs shown in this file: FY27E: -4.0% · FY28E: 3.0% · FY29E-FY32E: 4.0% · FY33E-FY36E: 3.0%
Read this driver’s forecast rationale
Industrial revenue fell 10% in FY26 to $1,844mm mainly because the aerospace and defense business was sold on 2025-09-02 (about $400mm; $115mm gain) and the Munich, Germany product division on 2026-01-30 (SEC Form 10-K for fiscal year ended 2026-06-30 (FY2026), filed 2026-08-14, MD&A and Note 7). Quarterly Industrial revenue was $491mm, $478mm, $444mm and $431mm through FY26, so the June 2026 quarter annualises to ~$1.72bn with neither business in it (Q4 FY2026 investor presentation, including its reconciliation tables (Form 8-K exhibit 99.2, filed 2026-08-12)). Segment profit rose 4% and demand from semiconductor capital equipment is described as strong (SEC Form 10-K for fiscal year ended 2026-06-30 (FY2026), filed 2026-08-14). The aerospace and defense business is removed from the forecast. Assumption: FY27 -4% (the June-quarter run-rate plus modest growth), +3% in FY28, then 4% fading to 3%, in line with industrial end markets. Limitation: Coherent reports Industrial only as one segment: no unit volumes, prices or product-level revenue (lasers, optics, materials for semiconductor equipment, instrumentation, sensing) are disclosed since the July 2025 realignment, and the aerospace and defense revenue that was sold is not stated separately.
Read the workbook’s historical source annotation
SEC Form 10-K for fiscal year ended 2026-06-30 (FY2026), filed 2026-08-14, Note 3 - Revenue from Contracts with Customers and Note 20 - Segment and Geographic Reporting
The later forecast years contain modeling judgments. The historical labels, financial-period dates and valuation date are separate from any stock-price observation; this page does not supply a current market quote.
One company. One year of access.
Your US$19.99 one-time purchase includes 12 months of downloads and updates for this company’s model. No automatic renewal. Downloaded files remain usable after access ends; no fixed update cadence is promised.
Read the current version’s notes
USD in millions, fiscal year ending June 30. Base case: FY2027E and FY2028E revenue are set to land on analyst consensus; later years are this model's own assumptions, each explained in the last column. FY2027 is the current year and has no reported quarter yet (fiscal year started 1 July 2026).
Dates and descriptions reflect this workbook’s notes. They are not a claim of independent audit or a guarantee that its forecasts will occur.