Broadcom Excel edition
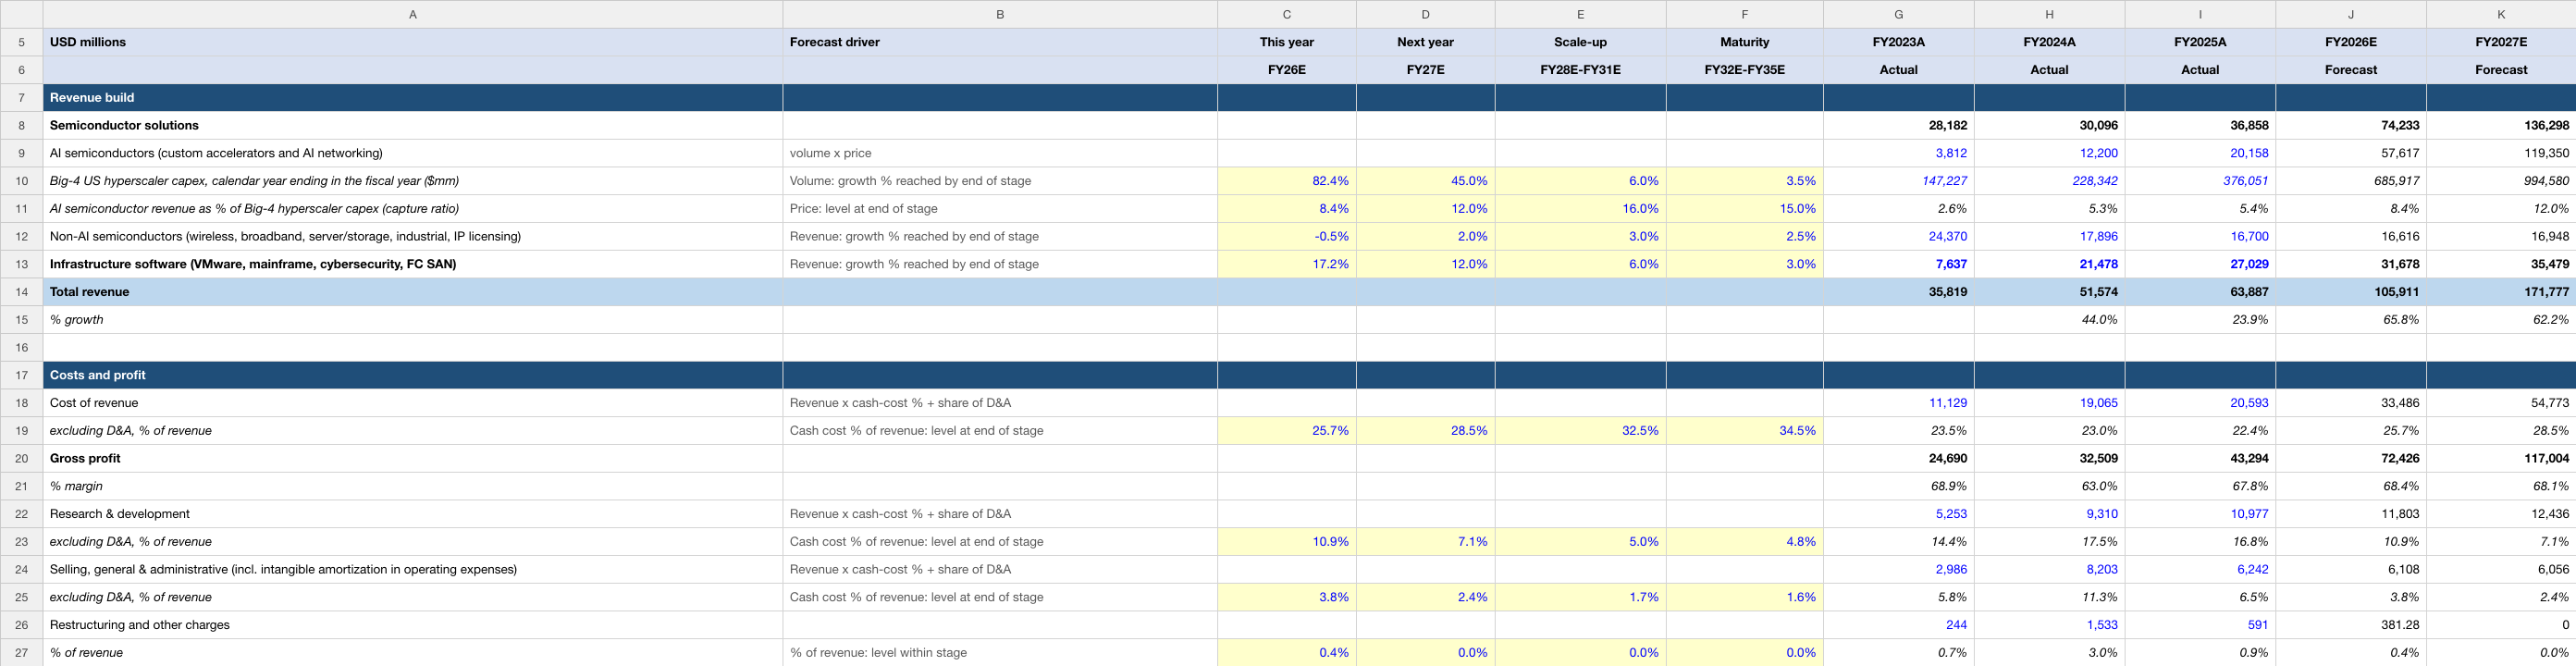
AI custom accelerators and networking tied to hyperscaler capex, non-AI chips and infrastructure software. Change the highlighted assumptions to explore the relationship between operating performance, cash flow and value.
Inside the workbook
- Income Statement, Balance Sheet, Cash Flow and DCF Valuation worksheets.
- Three historical fiscal years and ten modeled periods with source and forecast notes.
- Discounted cash flows, terminal-value methods and valuation sensitivities.
| Edition detail | Included |
|---|---|
| Valuation date | 5 October 2026 |
| Historical periods | FY2023A, FY2024A, FY2025A |
| Modeled periods | FY2026E–FY2035E |
| Financial currency | USD in millions |
| Format | Editable .xlsx · Four worksheets · 49.5 KB |
| Price | US$19.99 for 12 months of company-model access |
Historical figures recorded in this edition
These are cached historical entries in the uploaded Broadcom workbook, dated 5 October 2026. Fiscal-year labels and units follow the file; they are not live data. The source annotations below are the model author’s references, rather than an independent audit of every figure.
| Metric | FY2023A | FY2024A | FY2025A |
|---|---|---|---|
| Total revenue | 35,819.00 | 51,574.00 | 63,887.00 |
| Operating income (EBIT) | 16,207.00 | 13,463.00 | 25,484.00 |
| Net income | 14,082.00 | 5,895.00 | 23,126.00 |
How this edition builds the forecast
AI custom accelerators and networking tied to hyperscaler capex, non-AI chips and infrastructure software. The first forecast period is FY2026E. The editable assumptions distinguish the operating driver from the reasoning used to forecast it.
Big-4 US hyperscaler capex, calendar year ending in the fiscal year ($mm)
Mechanism: Volume: growth % reached by end of stage
Inputs shown in this file: FY26E: 82.4% · FY27E: 45.0% · FY28E-FY31E: 6.0% · FY32E-FY35E: 3.5%
Read this driver’s forecast rationale
Big-4 capex was $294.8bn in 1H 2026, up 84% on $160.1bn in 1H 2025 (hyperscaler 10-Qs for the quarter ended 2026-06-30 (Amazon.com filed 2026-07-31, Alphabet 2026-07-23, Meta Platforms 2026-07-30) and Microsoft 10-K FY2026 (filed 2026-07-29)). Published 2026 plans: Amazon ~$220bn and Alphabet up to $205bn (CNBC, 2026-07-30), Meta $130-145bn incl. finance leases (Meta Q2 2026 earnings release, 2026-07-29), Microsoft ~$175bn incl. finance leases (CNBC, 2026-07-29); analysts now forecast hyperscale capex above $1 trillion in 2027 and NVIDIA's CFO says AI infrastructure spending is on track for $3-4 trillion a year by the end of the decade (CNBC, 2026-05-21); megacap AI spending is projected at ~$765bn in 2026 rising to nearly $1.2tn in 2027 (Wall Street estimate reported by CNBC, 2026-07-31). Assumption: +82% in 2026 (~$686bn, below the mixed-basis plans because those include finance leases), +45% in 2027 (~$995bn), then growth fading year by year to 6% by 2031 (~$2.1tn) and to 3.5% by 2035.
Read the workbook’s historical source annotation
hyperscaler cash flow statements, purchases of (Microsoft: additions to) property and equipment: Amazon.com 10-K FY2025 filed 2026-02-06; Alphabet 10-K FY2025 filed 2026-02-05; Meta Platforms 10-K FY2025 filed 2026-01-29; Microsoft 10-K FY2025 filed 2025-07-30 and 10-Qs for Dec-2023 (filed 2024-01-30) and Dec-2025 (filed 2026-01-28). Terms: Amazon + Alphabet + Meta + Microsoft; Microsoft (June year end) is put on a calendar year as fiscal year - prior July-December + current July-December. Broadcom's fiscal year ends about 1 November, so calendar 2025 is matched with FY2025 (a two-month offset).
AI semiconductor revenue as % of Big-4 hyperscaler capex (capture ratio)
Mechanism: Price: level at end of stage
Inputs shown in this file: FY26E: 8.4% · FY27E: 12.0% · FY28E-FY31E: 16.0% · FY32E-FY35E: 15.0%
Read this driver’s forecast rationale
Implied ratio 2.6% / 5.3% / 5.4% in FY2023-FY2025 and 8.4% in FY2026E. FY2026E is reported plus guided: AI revenue of $8.4bn, $10.8bn and $16.7bn in Q1-Q3 (Q1 FY2026 earnings release (Form 8-K exhibit 99.1, filed 2026-03-04); Q2 FY2026 earnings release (Form 8-K exhibit 99.1, filed 2026-06-03); Q3 FY2026 earnings release (Form 8-K exhibit 99.1, filed 2026-09-02)) plus the $21.7bn Q4 outlook (Q3 FY2026 earnings release (Form 8-K exhibit 99.1, filed 2026-09-02)) = $57.6bn, in line with the ~$58bn the CEO now expects (The Motley Fool, 2026-09-03, 'Hock Tan Just Put a $230 Billion Number on Broadcom's 2028 AI Revenue' (quotes the Q3 FY2026 earnings call)). FY2027E: management says it has 'secured the supply to again double AI revenue to approximately $115 billion' and that demand exceeds that outlook (The Motley Fool, 2026-09-03, 'Hock Tan Just Put a $230 Billion Number on Broadcom's 2028 AI Revenue' (quotes the Q3 FY2026 earnings call); CNBC, 2026-09-14, 'Broadcom CEO addresses Anthropic's slowdown push, says AI revenue targets haven't changed'). 12.0% x ~$995bn is ~$119bn, 4% above that figure: consensus total revenue ($173.9bn) leaves ~$121bn for AI after software and non-AI semiconductors. Assumption: the ratio rises because frontier AI labs (Anthropic is on track to become the largest custom-chip customer in 2027, CNBC, 2026-09-14, 'Broadcom CEO addresses Anthropic's slowdown push, says AI revenue targets haven't changed') and the AI XPV financing platform (SEC Form 10-Q for quarter ended 2026-08-02 (Q3 FY2026), filed 2026-09-10, MD&A) fund deployments that are not all in Big-4 capex. FY2028E-FY2031E: management gives line of sight to $230bn in FY2028 (CNBC, 2026-09-14, 'Broadcom CEO addresses Anthropic's slowdown push, says AI revenue targets haven't changed'); this model is more cautious because deployment depends on customers' land, power and access to capital, which the CEO himself flags (The Motley Fool, 2026-09-03, 'Hock Tan Just Put a $230 Billion Number on Broadcom's 2028 AI Revenue' (quotes the Q3 FY2026 earnings call); SEC Form 10-Q for quarter ended 2026-08-02 (Q3 FY2026), filed 2026-09-10, MD&A), and because Marvell has signed a custom-chip agreement with Alphabet worth up to $120bn through fiscal 2033 (Yahoo Finance, 2026-09-02, 'Broadcom stock drops on Q4 guide miss; co sees revenue doubling in 2027 and 2028'). Backlog is large: $179.2bn of remaining performance obligations, ~25% of it due within 12 months (SEC Form 10-Q for quarter ended 2026-08-02 (Q3 FY2026), filed 2026-09-10, Note 2). Assumption: the ratio climbs steadily to 16% by FY2031 (AI revenue ~$175bn in FY2028, ~$330bn in FY2031) then eases to 15% at maturity.
Non-AI semiconductors (wireless, broadband, server/storage, industrial, IP licensing)
Mechanism: Revenue: growth % reached by end of stage
Inputs shown in this file: FY26E: -0.5% · FY27E: 2.0% · FY28E-FY31E: 3.0% · FY32E-FY35E: 2.5%
Read this driver’s forecast rationale
Segment revenue less AI revenue was $4.1bn, $4.2bn and $4.1bn in Q1-Q3 FY2026 (Q1 FY2026 earnings release (Form 8-K exhibit 99.1, filed 2026-03-04); Q2 FY2026 earnings release (Form 8-K exhibit 99.1, filed 2026-06-03); Q3 FY2026 earnings release (Form 8-K exhibit 99.1, filed 2026-09-02)), i.e. flat for six quarters at about $16.6bn a year after falling from $24bn in FY2023. FY2026E = $12.5bn for nine months plus ~$4.15bn for Q4. Assumption: flat in FY2026, +2% in FY2027, then low-single-digit growth as wireless and enterprise networking cycle. Limitation: The 10-K and 10-Qs give semiconductor revenue only as one segment total (plus products vs services and by region); revenue by end market (wireless, broadband, server and storage connectivity, industrial) is not in the filings, and the line also contains IP licensing. AI revenue is stated in rounded $bn, so this residual carries that rounding (about +/- $0.05bn a quarter). No unit or price data.
Read the workbook’s historical source annotation
Semiconductor solutions segment revenue (SEC Form 10-K for fiscal year ended 2025-11-02 (FY2025), filed 2025-12-18, Note 13) less AI semiconductor revenue above
The later forecast years contain modeling judgments. The historical labels, financial-period dates and valuation date are separate from any stock-price observation; this page does not supply a current market quote.
One company. One year of access.
Your US$19.99 one-time purchase includes 12 months of downloads and updates for this company’s model. No automatic renewal. Downloaded files remain usable after access ends; no fixed update cadence is promised.
Read the current version’s notes
USD in millions, fiscal year ending Sunday closest to 31 October (FY2025 ended 2-Nov-2025; FY2026 ends 1-Nov-2026; modelled as 1 November each year). Base case: FY2026E is nine reported months ($71.1bn) plus the guided fourth quarter ($34.8bn); FY2027E is set so total revenue lands close to analyst consensus; later years are this model's own assumptions, each explained in the last column.
Dates and descriptions reflect this workbook’s notes. They are not a claim of independent audit or a guarantee that its forecasts will occur.