American Electric Power Excel edition
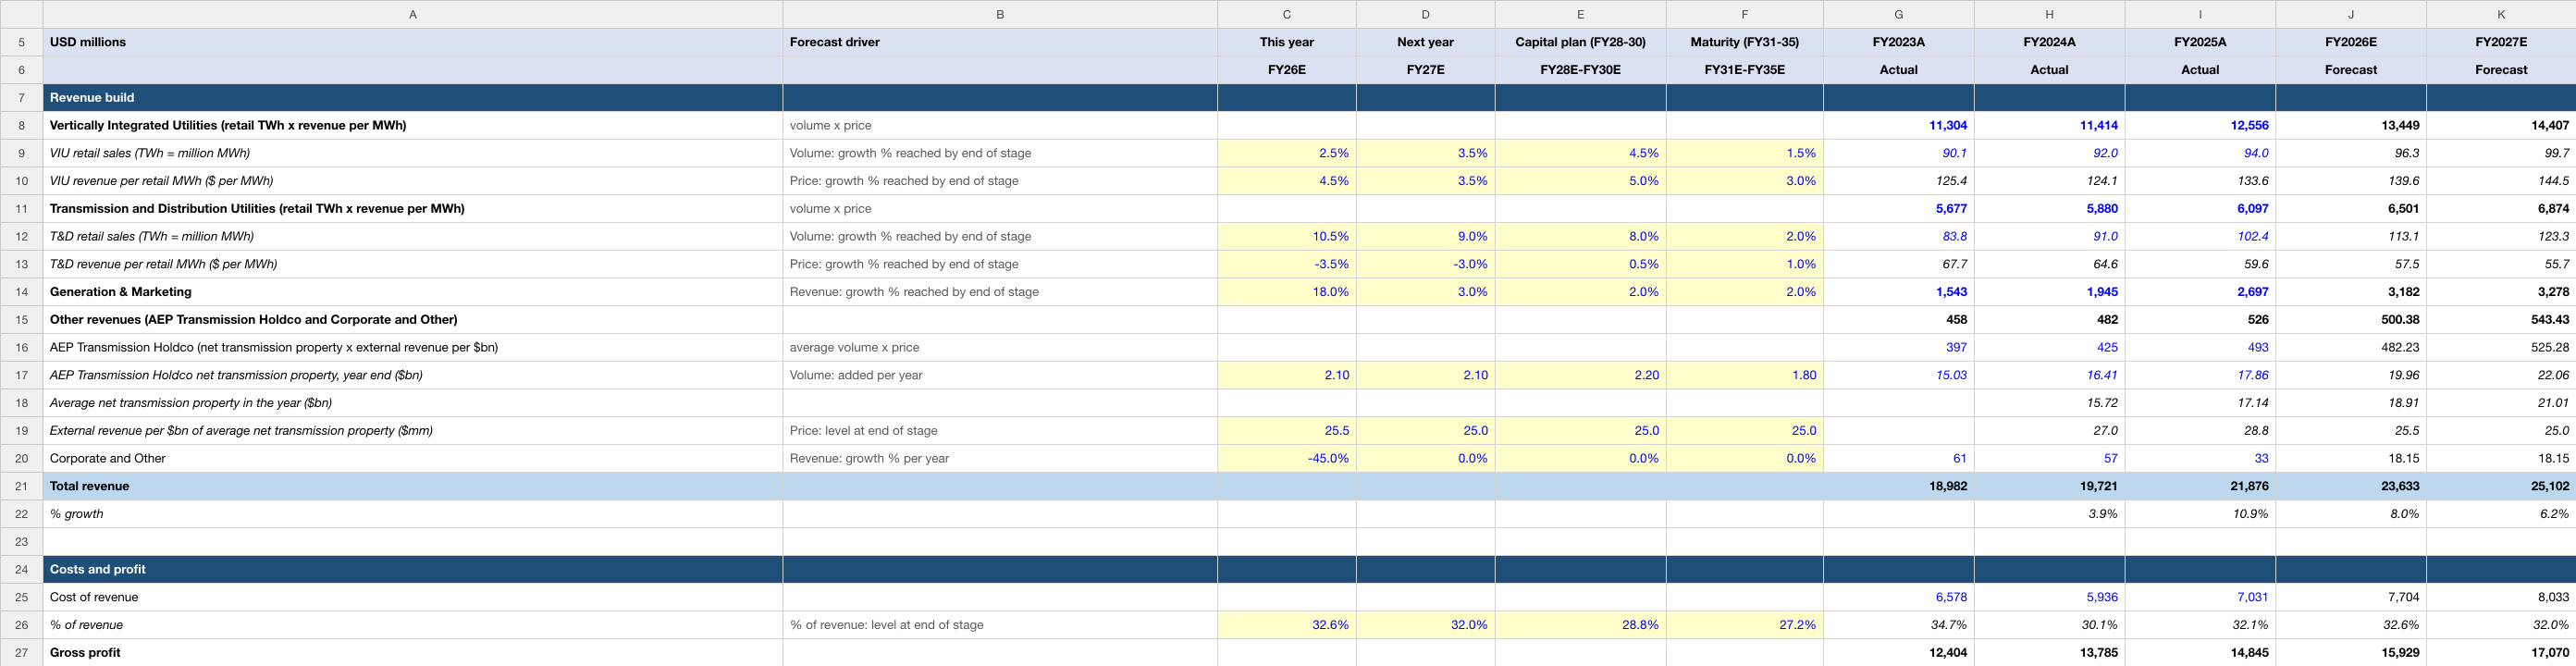
Vertically integrated and T&D retail sales, revenue per MWh and AEP Transmission Holdco. Change the highlighted assumptions to explore the relationship between operating performance, cash flow and value.
Inside the workbook
- Income Statement, Balance Sheet, Cash Flow and DCF Valuation worksheets.
- Three historical fiscal years and ten modeled periods with source and forecast notes.
- Discounted cash flows, terminal-value methods and valuation sensitivities.
| Edition detail | Included |
|---|---|
| Valuation date | 5 October 2026 |
| Historical periods | FY2023A, FY2024A, FY2025A |
| Modeled periods | FY2026E–FY2035E |
| Financial currency | USD in millions |
| Format | Editable .xlsx · Four worksheets · 61.8 KB |
| Price | US$19.99 for 12 months of company-model access |
Historical figures recorded in this edition
These are cached historical entries in the uploaded American Electric Power workbook, dated 5 October 2026. Fiscal-year labels and units follow the file; they are not live data. The source annotations below are the model author’s references, rather than an independent audit of every figure.
| Metric | FY2023A | FY2024A | FY2025A |
|---|---|---|---|
| Total revenue | 18,982.00 | 19,721.00 | 21,876.00 |
| Operating income (EBIT) | 3,556.00 | 4,304.00 | 5,319.00 |
| Net income | 2,208.00 | 2,967.00 | 3,580.00 |
How this edition builds the forecast
Vertically integrated and T&D retail sales, revenue per MWh and AEP Transmission Holdco. The first forecast period is FY2026E. The editable assumptions distinguish the operating driver from the reasoning used to forecast it.
VIU retail sales (TWh = million MWh)
Mechanism: Volume: growth % reached by end of stage
Inputs shown in this file: FY26E: 2.5% · FY27E: 3.5% · FY28E-FY30E: 4.5% · FY31E-FY35E: 1.5%
Read this driver’s forecast rationale
Retail sales rose 2.0% in 2024 and 2.2% in 2025 (SEC Form 10-K for the year ended 2025-12-31, filed 2026-02-12, MD&A) and 2.8% in 1H26 (47,064 vs 45,767 million KWh; commercial +15.4%, residential -2.9%, industrial -0.7%; Second-quarter 2026 earnings release (Form 8-K Exhibit 99.1), filed 2026-07-30, Summary of Selected Sales Data). AEP reports 69 GW of signed new-load agreements through 2030, mainly hyperscale data centres (Second-quarter 2026 earnings release (Form 8-K Exhibit 99.1), filed 2026-07-30), and the 10-K projects peak-demand growth by 2030 with the strongest growth in Indiana, Ohio, Oklahoma and Texas (SEC Form 10-K for the year ended 2025-12-31, filed 2026-02-12, MD&A Electric Industry Transformation). Assumption: +2.5% in FY26 (the 1H26 run-rate), +3.5% in FY27, building to +4.5% by FY30 as contracted load connects (a fraction of the 69 GW, which is a company-wide figure across all segments), then fading to +1.5% by FY35 when the build-out ends.
Read the workbook’s historical source annotation
SEC Form 10-K for the year ended 2025-12-31, filed 2026-02-12, MD&A, Summary of KWh Energy Sales for Vertically Integrated Utilities: total retail 90,148 / 91,956 / 93,967 million KWh (2023 / 2024 / 2025); wholesale sales (16,039 million KWh in 2025) are excluded from the volume but their revenue is in the segment line
VIU revenue per retail MWh ($ per MWh)
Mechanism: Price: growth % reached by end of stage
Inputs shown in this file: FY26E: 4.5% · FY27E: 3.5% · FY28E-FY30E: 5.0% · FY31E-FY35E: 3.0%
Read this driver’s forecast rationale
Revenue per retail MWh was $125.4 / $124.1 / $133.6 in 2023-25 (segment revenue includes wholesale, transmission and fuel). Of the $956mm rise in 2025 retail revenue, $601mm was base-rate and rider revenue and $109mm fuel (SEC Form 10-K for the year ended 2025-12-31, filed 2026-02-12, MD&A VIU); 1H26 segment revenue rose 6.6% (6,415 vs 6,020) on 2.8% more volume (SEC Form 10-Q for the quarter ended 2026-06-30, filed 2026-07-30, income statement). Price is anchored to rate base: net property, plant and equipment was $92.4bn at 31-Dec-2025 (SEC Form 10-K for the year ended 2025-12-31, filed 2026-02-12, balance sheet) and the 2026-2030 capital plan is $77.9bn, of which $40.9bn is VIU (SEC Form 10-Q for the quarter ended 2026-06-30, filed 2026-07-30, MD&A Budgeted Capital Expenditures); after about 4% a year of depreciation that is rate-base growth of about 10% a year. Regulated revenue is the return on and of that rate base plus costs, including income tax. Operating income was 6.1% of average net PP&E in FY2025 (5,319 on 87.4bn) and the model has 5.8% in FY26 and 6.0% in FY27 while construction work in progress ($9.7bn at 30-Jun-2026; SEC Form 10-Q for the quarter ended 2026-06-30, filed 2026-07-30) builds; it rises as the plan is placed in service and recovered through base rates and riders. Fuel (about 30% of segment revenue) is passed through and grows with volume only, so segment revenue grows less than rate base in the early years. FY28-30 are anchored on a public marker. The 2Q26 release reaffirms operating earnings growth of 7% to 9% a year through 2030, with a compound annual growth rate above 9% from the 2025 guidance midpoint (Second-quarter 2026 earnings release (Form 8-K Exhibit 99.1), filed 2026-07-30). The model's earnings per share are net income over its own weighted share count: 544mm basic shares at 30-Jul-2026 (SEC Form 10-Q for the quarter ended 2026-06-30, filed 2026-07-30, cover page), plus the 44mm forward-sale shares that settle in FY26-28 (SEC Form 10-K for the year ended 2025-12-31, filed 2026-02-12, Note 15; SEC Form 8-K dated 2026-05-12 (forward sale agreements), filed 2026-05-14; SEC Form 10-Q for the quarter ended 2026-06-30, filed 2026-07-30, Note 12), plus the typed issuance of $3.0-3.5bn a year through FY30 at an assumed $130-140 a share (equity row), so weighted shares grow about 4.3% a year (550mm in FY26, about 650mm in FY30). On that count EPS is $6.34 in FY26 (net income 3,488) and $8.56 in FY30 (5,568), a CAGR of 7.8%: inside the 7-9% range, 0.8 points above its bottom (it was 7.2% before the deferred-tax cash flow on the Cash Flow tab, which lowers borrowing and interest and lifts FY30 net income by about 2.4%, 5,568 against 5,437; the revenue drivers were not re-tuned), and below the above-9% CAGR the company expects, which the model does not target. Operating EPS excludes items such as mark-to-market and one-offs ($0.09 a share in 1H26; Second-quarter 2026 earnings release (Form 8-K Exhibit 99.1), filed 2026-07-30), so the comparison with GAAP EPS is approximate. FY30 operating income is 6.55% of average net PP&E. FY31-35 hold the FY30 after-tax return rather than the pre-tax return. Income tax is a cost of service in regulated rates, and the model's tax rate rises from 13% in FY30 to 19% in FY35 (20.7% terminal) as production tax credits and the amortization of excess deferred income taxes run off; the 10-K says Excess ADIT regulatory liabilities are 'to be refunded to customers' (SEC Form 10-K for the year ended 2025-12-31, filed 2026-02-12, MD&A, NOLCs in Transmission Formula Rates and NOLCs in Retail Jurisdictions), so when the refund ends rates rise to carry the full tax cost. Holding the pre-tax return flat at 6.55% would cut the after-tax return from 5.70% in FY30 to 5.31% in FY35 (6.55% x (1 - 19%)) and let earned ROE sink further below the 9.85% weighted authorised ROE used for RONIC (latest orders, SEC Form 10-K for the year ended 2025-12-31, filed 2026-02-12, Item 1 and Note 4; SEC Form 10-Q for the quarter ended 2026-06-30, filed 2026-07-30, Note 4; weights and sources in the RONIC row on the DCF tab). Operating income of 7.0% of average net PP&E in FY35 keeps the after-tax return at 5.7% (5.67% in FY35 against 5.70% in FY30); earned ROE is 10.1% in FY30 and 9.3% in FY35. Assumption: +4.5% in FY26 and +3.5% in FY27 (these two years land total revenue on consensus: $23.6bn and $25.1bn), rising to +5.0% by FY30 (revenue per MWh rose 7.7% in 2025, $124.1 to $133.6, so this is below the recent pace; VIU segment revenue then grows 8.0% / 8.9% / 9.7% in FY28-30 against net PP&E growth of 10.8% / 9.5% / 8.5%), and fading to +3.0% by FY35 as the build-out ends and the tax cost is recovered.
T&D retail sales (TWh = million MWh)
Mechanism: Volume: growth % reached by end of stage
Inputs shown in this file: FY26E: 10.5% · FY27E: 9.0% · FY28E-FY30E: 8.0% · FY31E-FY35E: 2.0%
Read this driver’s forecast rationale
Deliveries rose 8.6% in 2024 and 12.4% in 2025 (SEC Form 10-K for the year ended 2025-12-31, filed 2026-02-12, MD&A) and 11.7% in 1H26 (53,702 vs 48,088 million KWh; commercial +24.8%, industrial +8.5%, residential -5.0%; Second-quarter 2026 earnings release (Form 8-K Exhibit 99.1), filed 2026-07-30), driven by data-centre load in Texas. Signed load agreements in AEP Texas alone rose from 13 GW to 36 GW between October 2025 and February 2026 (Fourth-quarter 2025 earnings release (Form 8-K Exhibit 99.1), filed 2026-02-12) and company-wide agreements reached 69 GW through 2030 (Second-quarter 2026 earnings release (Form 8-K Exhibit 99.1), filed 2026-07-30). Assumption: +10.5% in FY26 (the 1H26 pace), +9% in FY27, +8% a year by FY30 (well below what 69 GW would imply, because only part is firm and timing is uncertain), fading to +2% by FY35.
Read the workbook’s historical source annotation
SEC Form 10-K for the year ended 2025-12-31, filed 2026-02-12, MD&A, Summary of KWh Energy Sales for Transmission and Distribution Utilities: total retail (energy delivered to distribution customers) 83,834 / 91,039 / 102,372 million KWh (2023 / 2024 / 2025); OVEC wholesale sales are excluded
The later forecast years contain modeling judgments. The historical labels, financial-period dates and valuation date are separate from any stock-price observation; this page does not supply a current market quote.
One company. One year of access.
Your US$19.99 one-time purchase includes 12 months of downloads and updates for this company’s model. No automatic renewal. Downloaded files remain usable after access ends; no fixed update cadence is promised.
Read the current version’s notes
USD in millions, fiscal year ending December 31. Base case for a rate-regulated electric utility: FY2026E and FY2027E revenue land on analyst consensus and FY2026E net income sits near the middle of the published GAAP guidance; FY2028-FY2030 follow the published 2026-2030 capital plan, with revenue per MWh set (before the deferred-tax cash flow was added, earnings per share on the model's own share count grew 7.2% a year through FY2030; the deferral lowers borrowing and interest, so they now grow 7.8%, inside the company's published 7%-9% target, and the revenue drivers were not re-tuned); later years hold the after-tax return on net PP&E while tax credits run off, then fade to maturity. Every assumption is explained in the last column. The capital plan is partly equity-funded in practice; the model types the equity issuance and borrows the rest, and the per-share value counts only the forward sale shares already contracted.
Dates and descriptions reflect this workbook’s notes. They are not a claim of independent audit or a guarantee that its forecasts will occur.